Best Trading & Fintech Dashboard Templates 2026
Best Trading & Fintech Dashboard Templates in 2026
Most "trading dashboard templates" you find on Google are chart demos with hardcoded data and no real-time updates. A real trading dashboard is more: WebSocket-driven price feeds, charts that stay smooth under load, portfolio valuation that updates on every tick, order entry with type-safe validation, watchlists with alerts, and tax reporting that doesn't fall apart in April.
We compared 7 options on real-time data quality, charts, portfolio tracking, and customization.
For a deeper rubric, see our How to Build a Trading Dashboard in Next.js guide.
TL;DR: Quick Picks for 2026
| Need | Top pick | Price |
|---|---|---|
| Portfolio tracker (hosted) | Snowball Analytics | $7+/mo |
| Stock charting (hosted) | TradingView | $14+/mo |
| Crypto tracker (hosted) | CoinTracker | $14+/mo |
| Embedded in your Next.js app | thefrontkit Trading Dashboard Template | $131 one-time |
| Personal finance variant | thefrontkit Finance Dashboard Kit | $131 |
What Makes a Real Trading Dashboard Template?
Before evaluating any candidate:
- Real-time price feeds via WebSocket with reconnection
- Production-grade charts (Lightweight Charts or equivalent)
- Portfolio valuation that updates on every tick
- Order entry with type-safe validation (if trading is part of the product)
- Watchlists with alerts
- Tax-lot accounting and capital gains reporting
- Mobile UX (a huge portion of trading is mobile)
- Dark mode (table stakes for trader audiences)
If a template is "just a candlestick chart with sample data," it's a demo.
1. TradingView
The dominant charting platform. Used by millions of traders.
Strengths:
- Best-in-class charts and indicators
- Massive symbol coverage
- Strong community (Pine Script for custom indicators)
- Free tier is generous
Weaknesses:
- Hosted product, not a template
- Embedding via widgets is limited
- Their Lightweight Charts library is the OSS path
Best for: Traders who want world-class charts and don't need a custom product.
2. TradingView Lightweight Charts (OSS Library)
The free, OSS charting library from the same team.
Strengths:
- Free, MIT license
- 45kb, GPU-accelerated
- Production-grade candlestick and line charts
- The default for any developer building trading UI in 2026
Weaknesses:
- A library, not a template — you build everything else
- No order entry, portfolio, watchlists, just charts
Best for: Building your own trading dashboard. This IS the chart you should use.
github.com/tradingview/lightweight-charts
3. Snowball Analytics
Hosted portfolio tracker for stocks, ETFs, crypto, and alternatives.
Strengths:
- Comprehensive portfolio tracking
- Tax reporting included
- Dividend tracking
- Custom alerts
Weaknesses:
- Hosted SaaS, monthly fees
- Not embeddable
- UI is functional but not modern
Best for: Individual investors who want a polished portfolio tracker without building anything.
4. CoinTracker
Crypto portfolio + tax software.
Strengths:
- Strong crypto exchange integrations
- Tax reporting for crypto (notoriously complex)
- Wallet sync
Weaknesses:
- Crypto only (not stocks)
- Hosted SaaS
- Pricing scales with transaction volume
Best for: Active crypto traders who need tax docs.
5. Plotly Finance Dashboards (Dash)
Python-based dashboards using Plotly.
Strengths:
- Powerful for analytics-heavy use cases
- Python ecosystem for financial data (pandas, NumPy)
- Strong charts
Weaknesses:
- Python, not Next.js
- Dashboards are functional but not modern UX
- Better for analytics than production trading UI
Best for: Quant researchers and data scientists, not customer-facing products.
6. Material UI Trading Templates
Several React templates exist using Material UI for trading dashboard UIs.
Strengths:
- Free or low-cost ($50-100 one-time)
- Get a starting point quickly
Weaknesses:
- Most are visual templates with sample data, not functional trading apps
- Material UI's look doesn't match what serious traders expect
- No WebSocket integration out of the box
- Limited customization for production use
Best for: Quick visual mockup. Not for shipping a real product.
7. thefrontkit Trading Dashboard Template
Best for embedding a broker-grade trading interface in your own Next.js product.
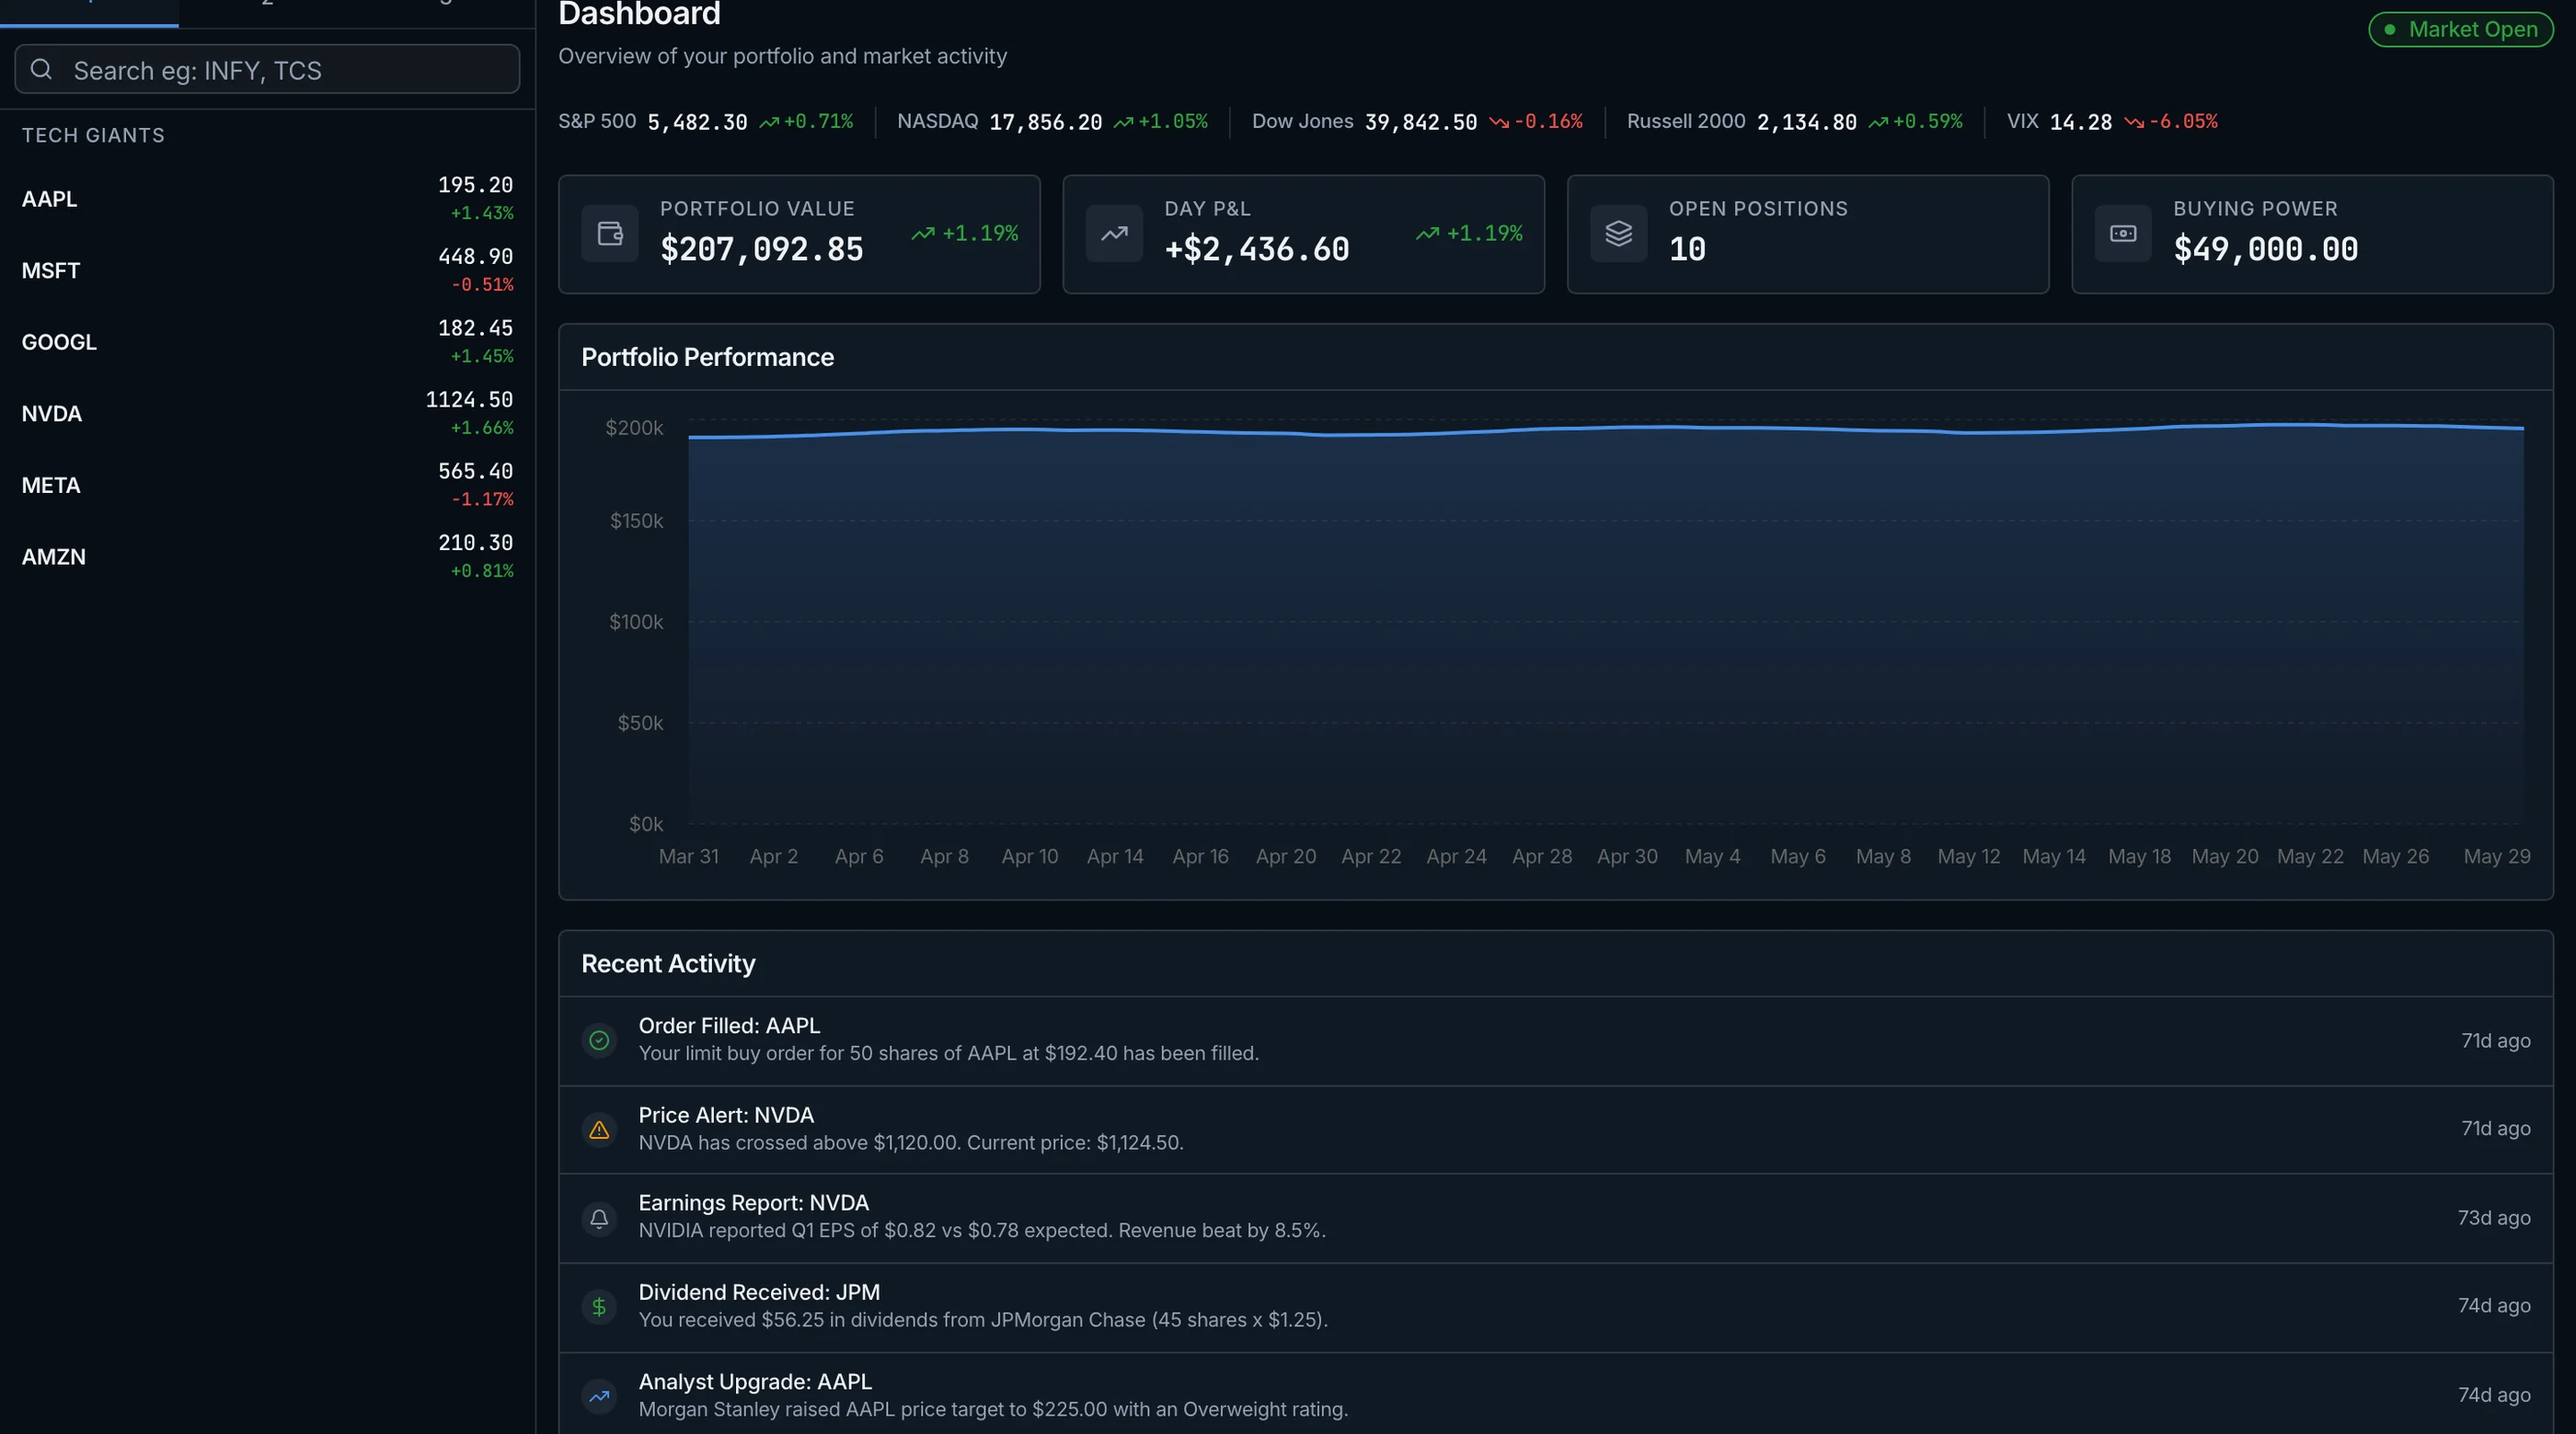
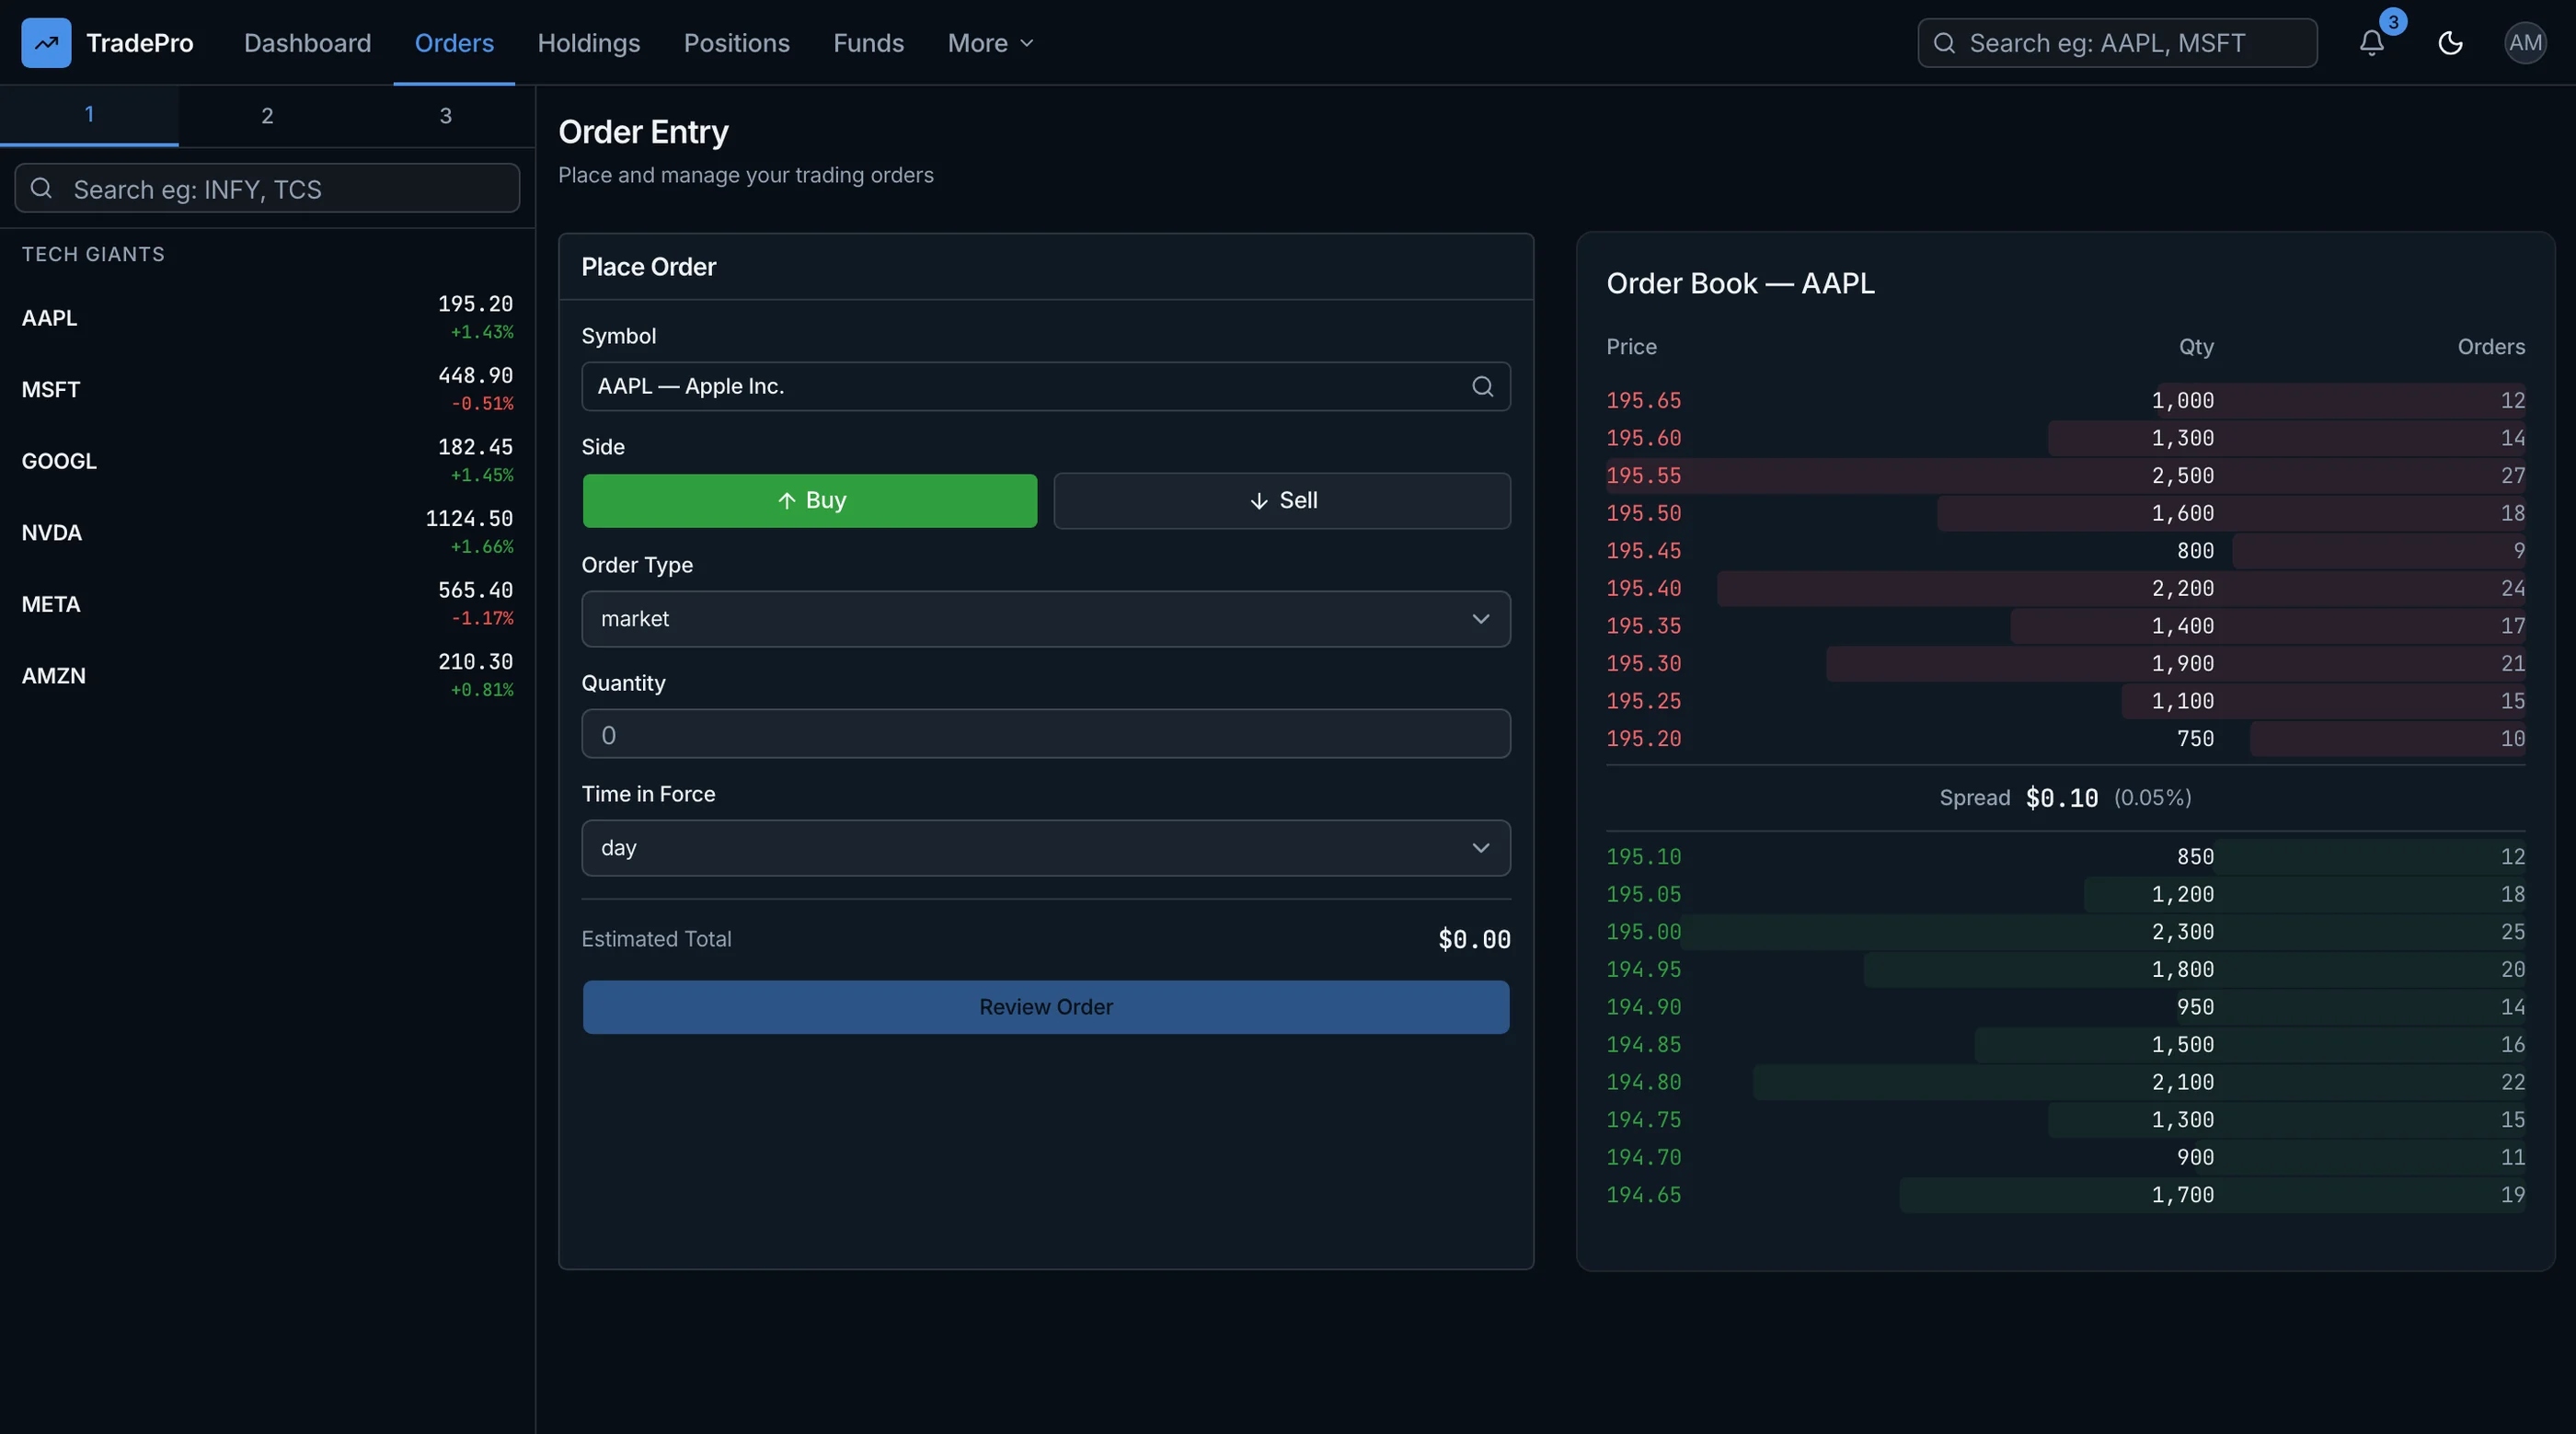
The Trading Dashboard Template from thefrontkit ships 70 screens in a Kite-inspired layout: a compact top navbar with tab navigation and an always-visible watchlist panel with numbered groups.
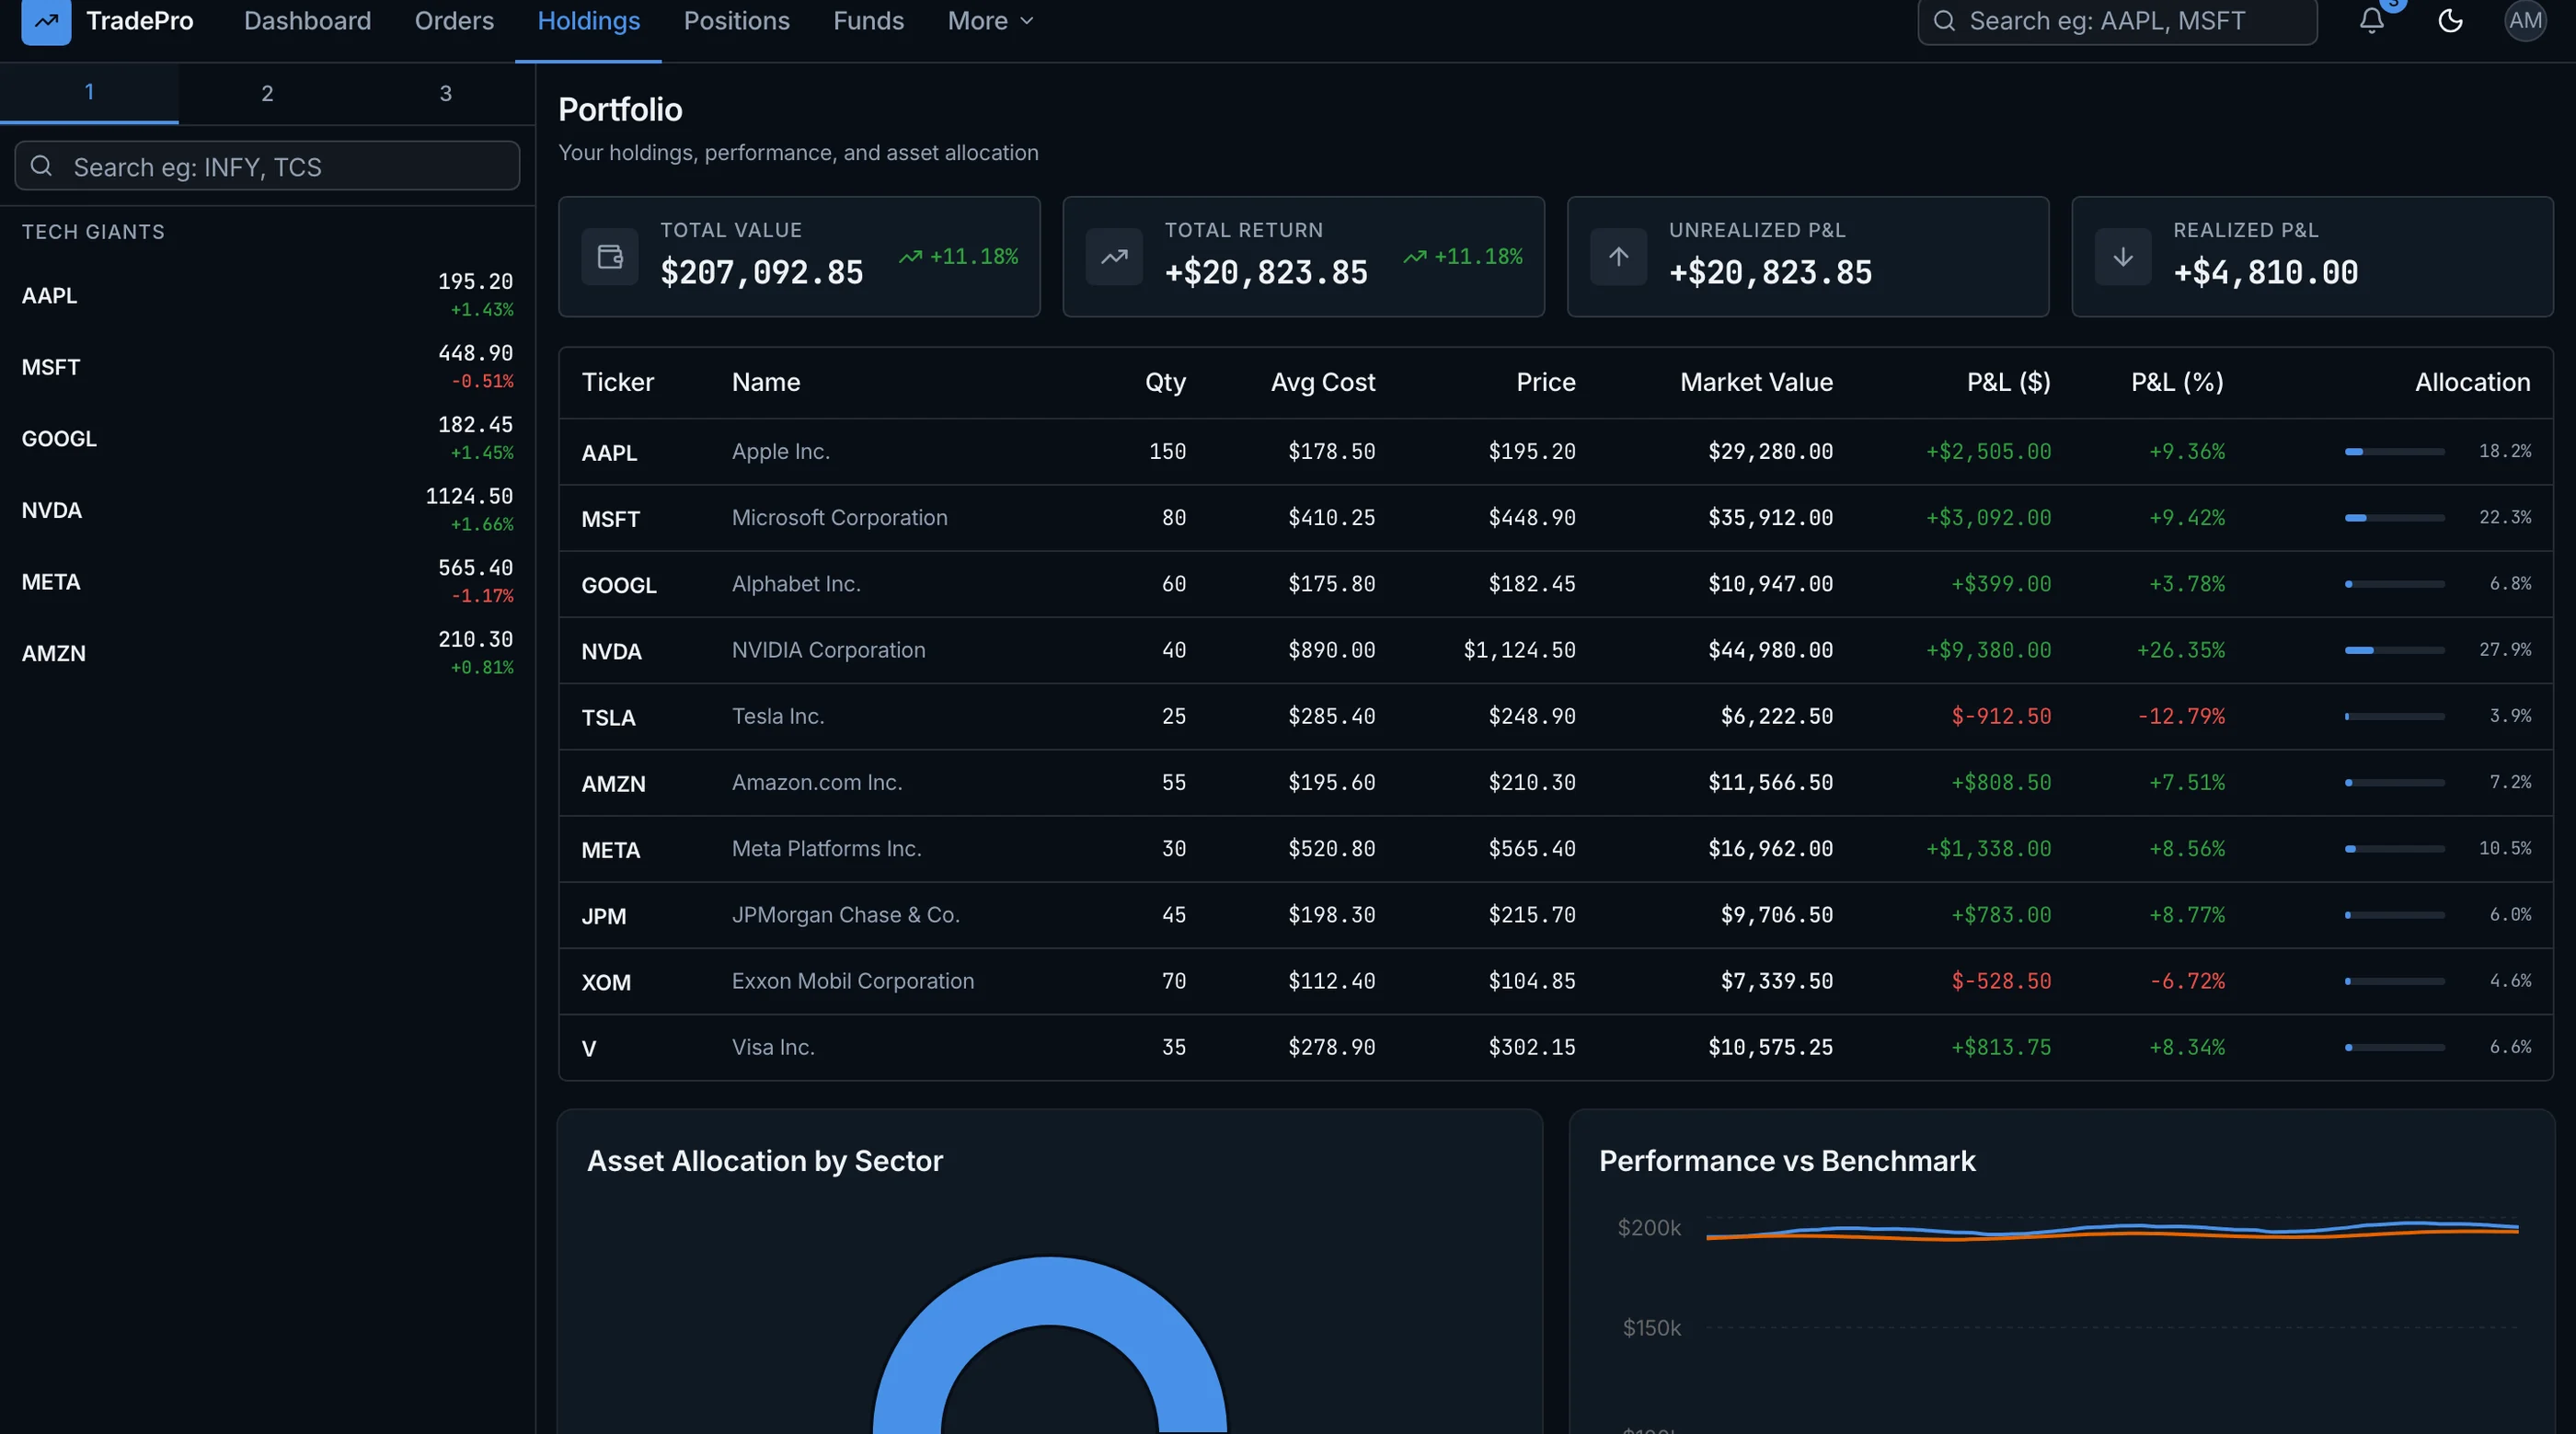
Trading screens cover order entry with order types, quantity, and time-in-force, sitting next to a real order book depth visualization with bid and ask levels. Positions tracker, trade history, and an options chain round it out. Portfolio management gives you a holdings table with ticker, quantity, cost basis, market value, P&L in both dollars and percent, and allocation bars.
Research adds stock detail pages with company fundamentals, technical indicators, and analyst ratings, plus a filterable screener with market cap, P/E, sector, and volume filters. Social trading ships a leaderboard of ranked traders with return percentages, win rates, and Sharpe ratios, plus copy trading and a strategy marketplace. Analytics covers a risk dashboard with Value at Risk, max drawdown, Sharpe ratio, beta, and concentration risk, alongside a backtesting view and P&L analysis.
The boundary matters more here than anywhere else on this list: this is the interface only. There is no market data feed, no WebSocket infrastructure, no brokerage API integration, and no order execution engine. There is also no regulatory compliance logic. If you are handling real money, the UI is genuinely the easy part, and this template is only the easy part done well.
Built on Next.js 16, Tailwind CSS v4, and shadcn/ui, WCAG AA throughout. Try the live demo.
- Screens: 39
- Trading: Order entry with order book depth, positions, options chain
- Portfolio: Holdings with cost basis, P&L, and allocation bars
- Research: Stock detail, fundamentals, technicals, filterable screener
- Risk: VaR, max drawdown, Sharpe, beta, concentration analysis
- Social: Leaderboard, copy trading, strategy marketplace
- Not included: Market data feed, WebSocket infra, brokerage API, compliance
- Price: $131 solo / $199 team / $349 agency
See the Trading Dashboard Template →
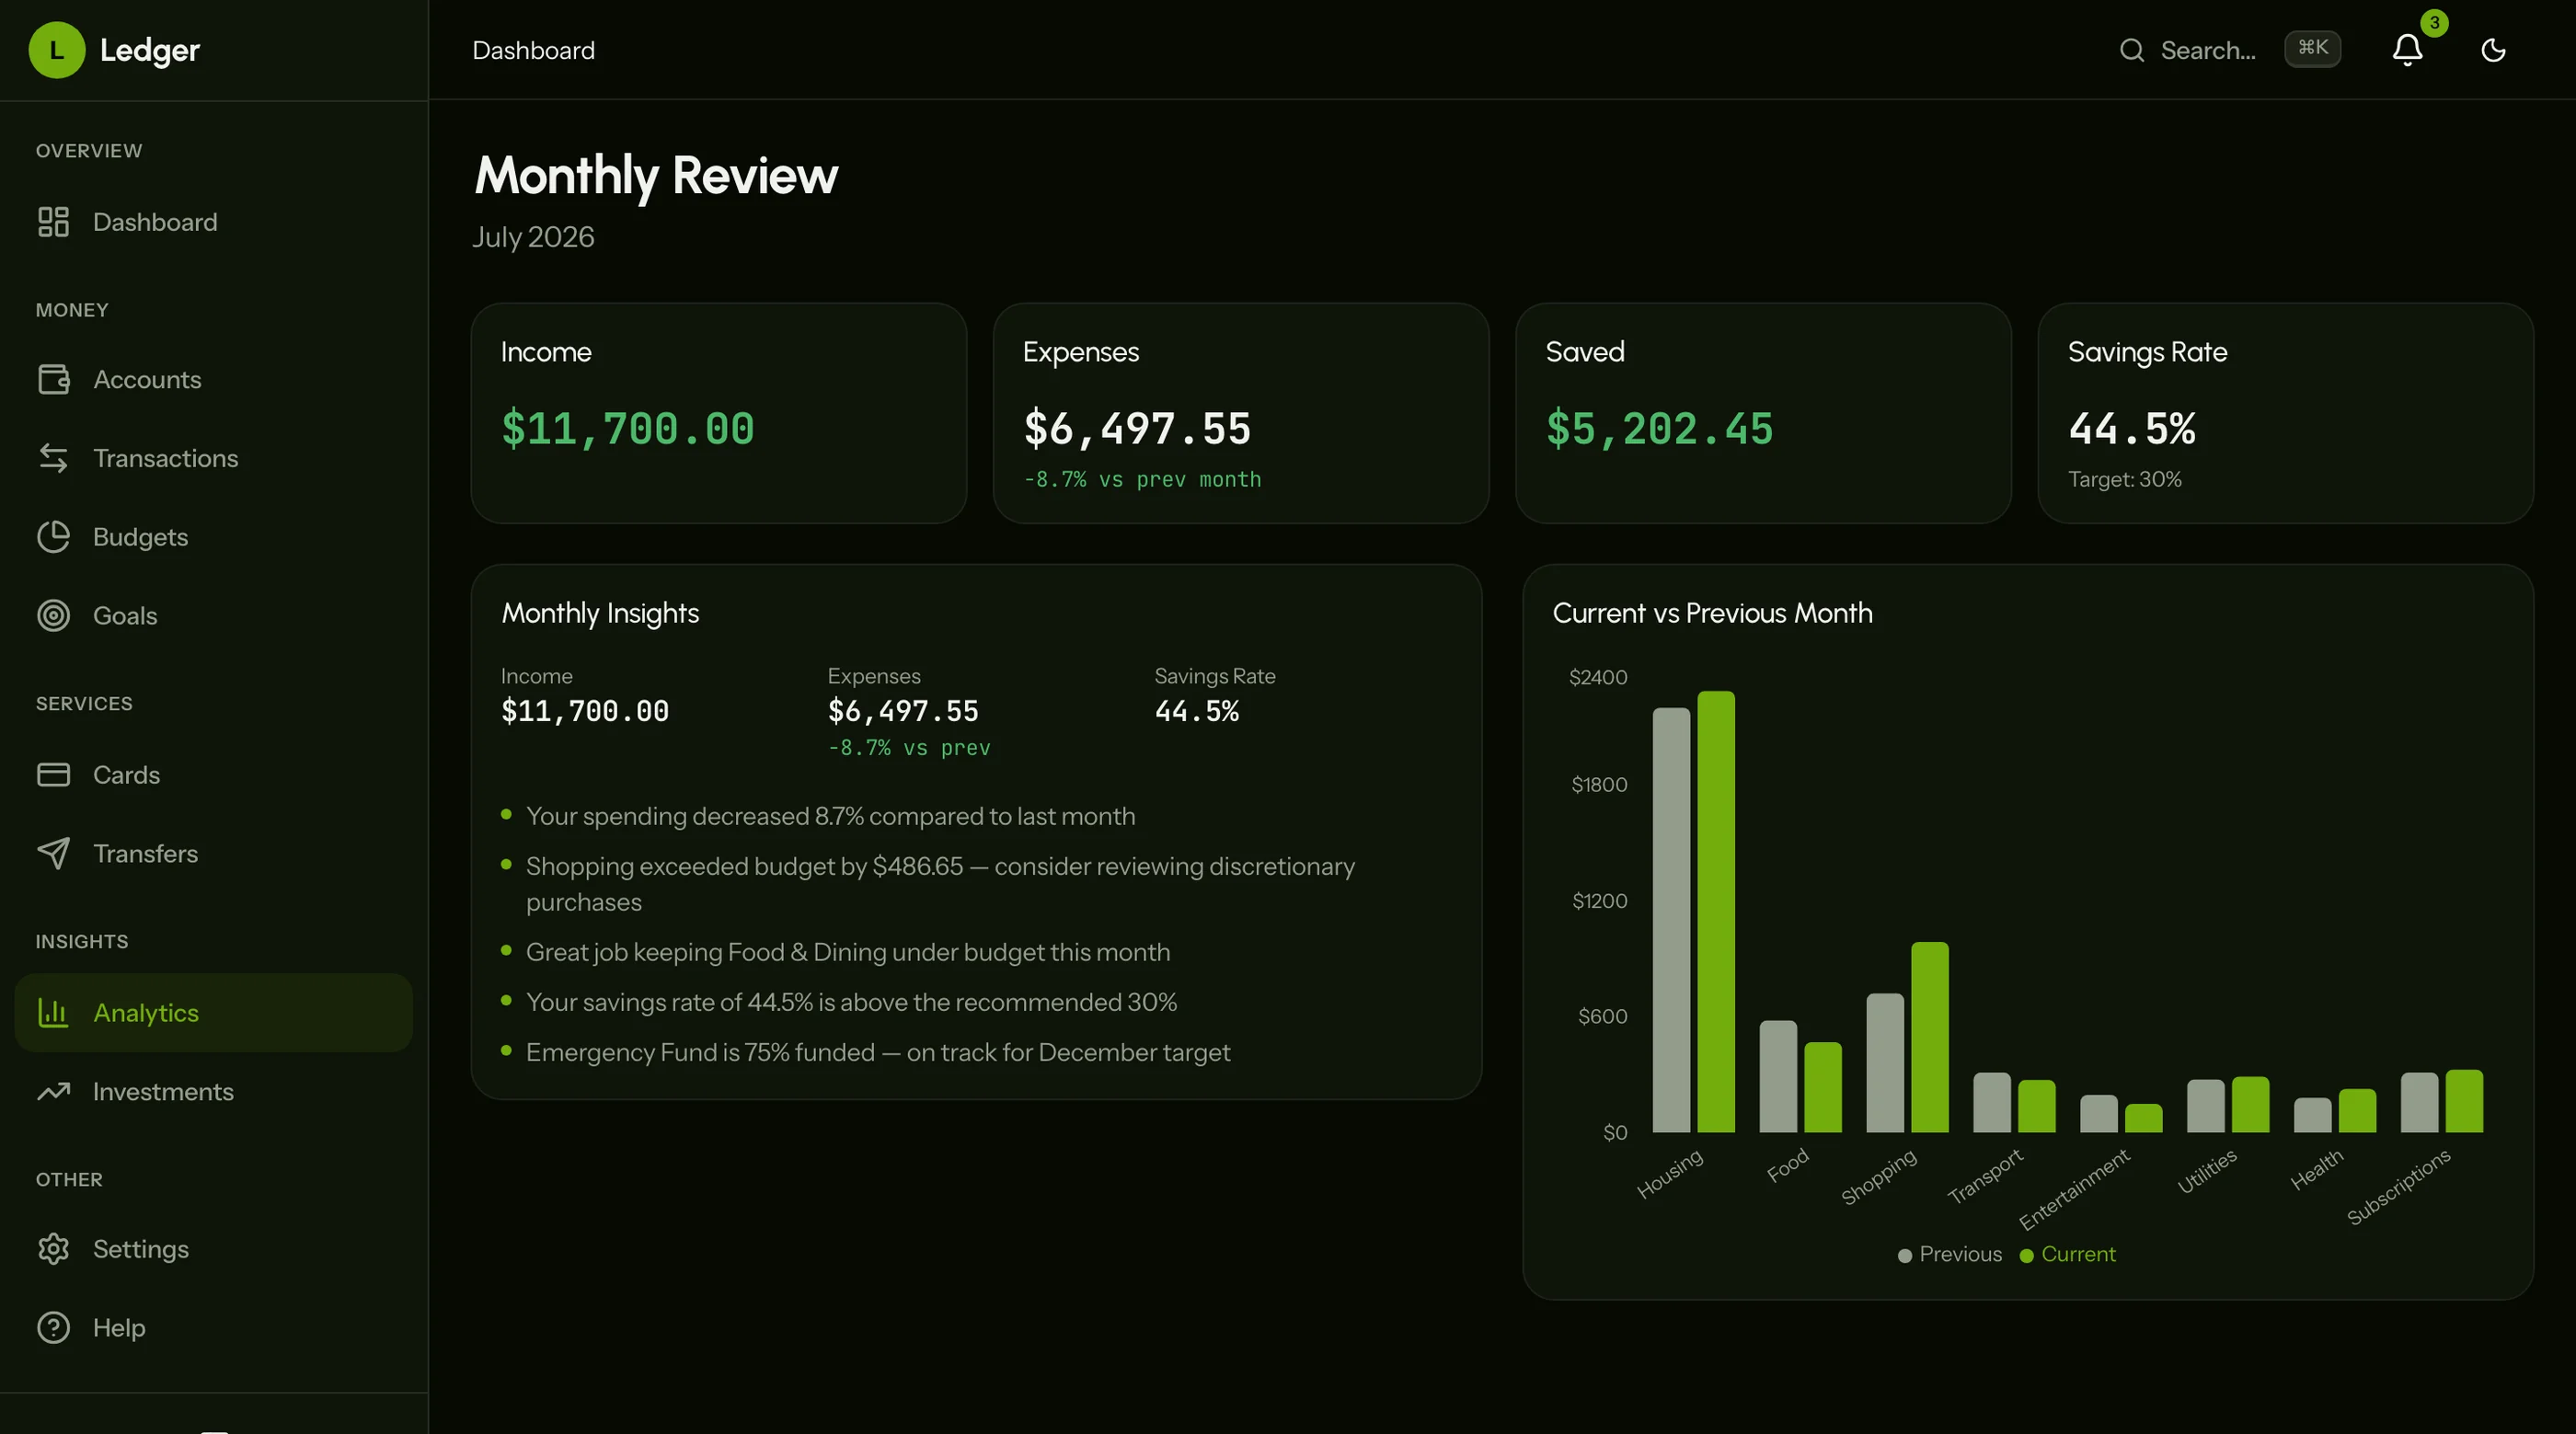
For a personal finance dashboard today (transactions, budgeting, accounts — not trading), see the Finance Dashboard Kit.
How to Choose
Three questions:
-
Trading or personal finance? Trading (order entry, portfolio P&L, screener, risk analytics): Trading Dashboard Template. Personal finance (budgeting, expenses, accounts): Finance Dashboard Kit.
-
Hosted or embedded? Hosted: TradingView, Snowball, CoinTracker for the use case. Embedded into your own product: the Trading Dashboard Template or fork an OSS project.
-
Are you handling real money? If yes, plan for SEC/FINRA/KYC/AML compliance separately. The UI is the easy part.
Adjacent Reads
- How to Build a Trading Dashboard in Next.js — architecture rubric
- How to Choose a Next.js Finance Dashboard Template — personal finance variant
- Best Finance Dashboard Templates 2026 — broader category
FAQ
Can I use TradingView's widget instead of building my own charts?
Yes for simple use cases (a chart on a marketing page or blog). No for products where you need control (custom indicators, integration with your watchlists, custom theming). Use Lightweight Charts library for full control.
What's the best free price data source?
Stocks: Alpaca Markets (free with brokerage account). Crypto: Binance and Coinbase WebSocket APIs are free. For both with a free tier: Finnhub.
Is real-time data legally complicated?
Yes for stocks. NYSE and Nasdaq data is licensed; redistributing or showing real-time prices to the public has fees and rules. For personal use or delayed data (15 minutes), it's much simpler. Get specific legal advice if you're building a public trading product.
Do I need to register with the SEC to build a trading dashboard?
Depends on what your app does. A read-only dashboard (no order routing) is generally not regulated. An app that places trades for users (broker-dealer activity) requires registration. Definitely get a securities lawyer involved before launch.
Is dark mode really that important for traders?
Yes. Traders stare at screens for 8+ hours. Eye strain is real. Dark mode is table stakes; light-only products feel amateur.
How many screens does a real trading dashboard need?
The minimum is around 18: overview, portfolio detail, holdings, watchlists, chart per symbol, order entry, order history, alerts, news, reports, tax tools, settings, integrations, and auth (5).