Social Media Analytics Dashboard Template
Track performance across Instagram, Twitter/X, Facebook, LinkedIn, TikTok, and YouTube from a single dashboard. Audience insights, engagement metrics, competitor benchmarks, and exportable reports. Built with Next.js and Recharts.
Starting at $79$13140% OFF· 7-day money-back guarantee
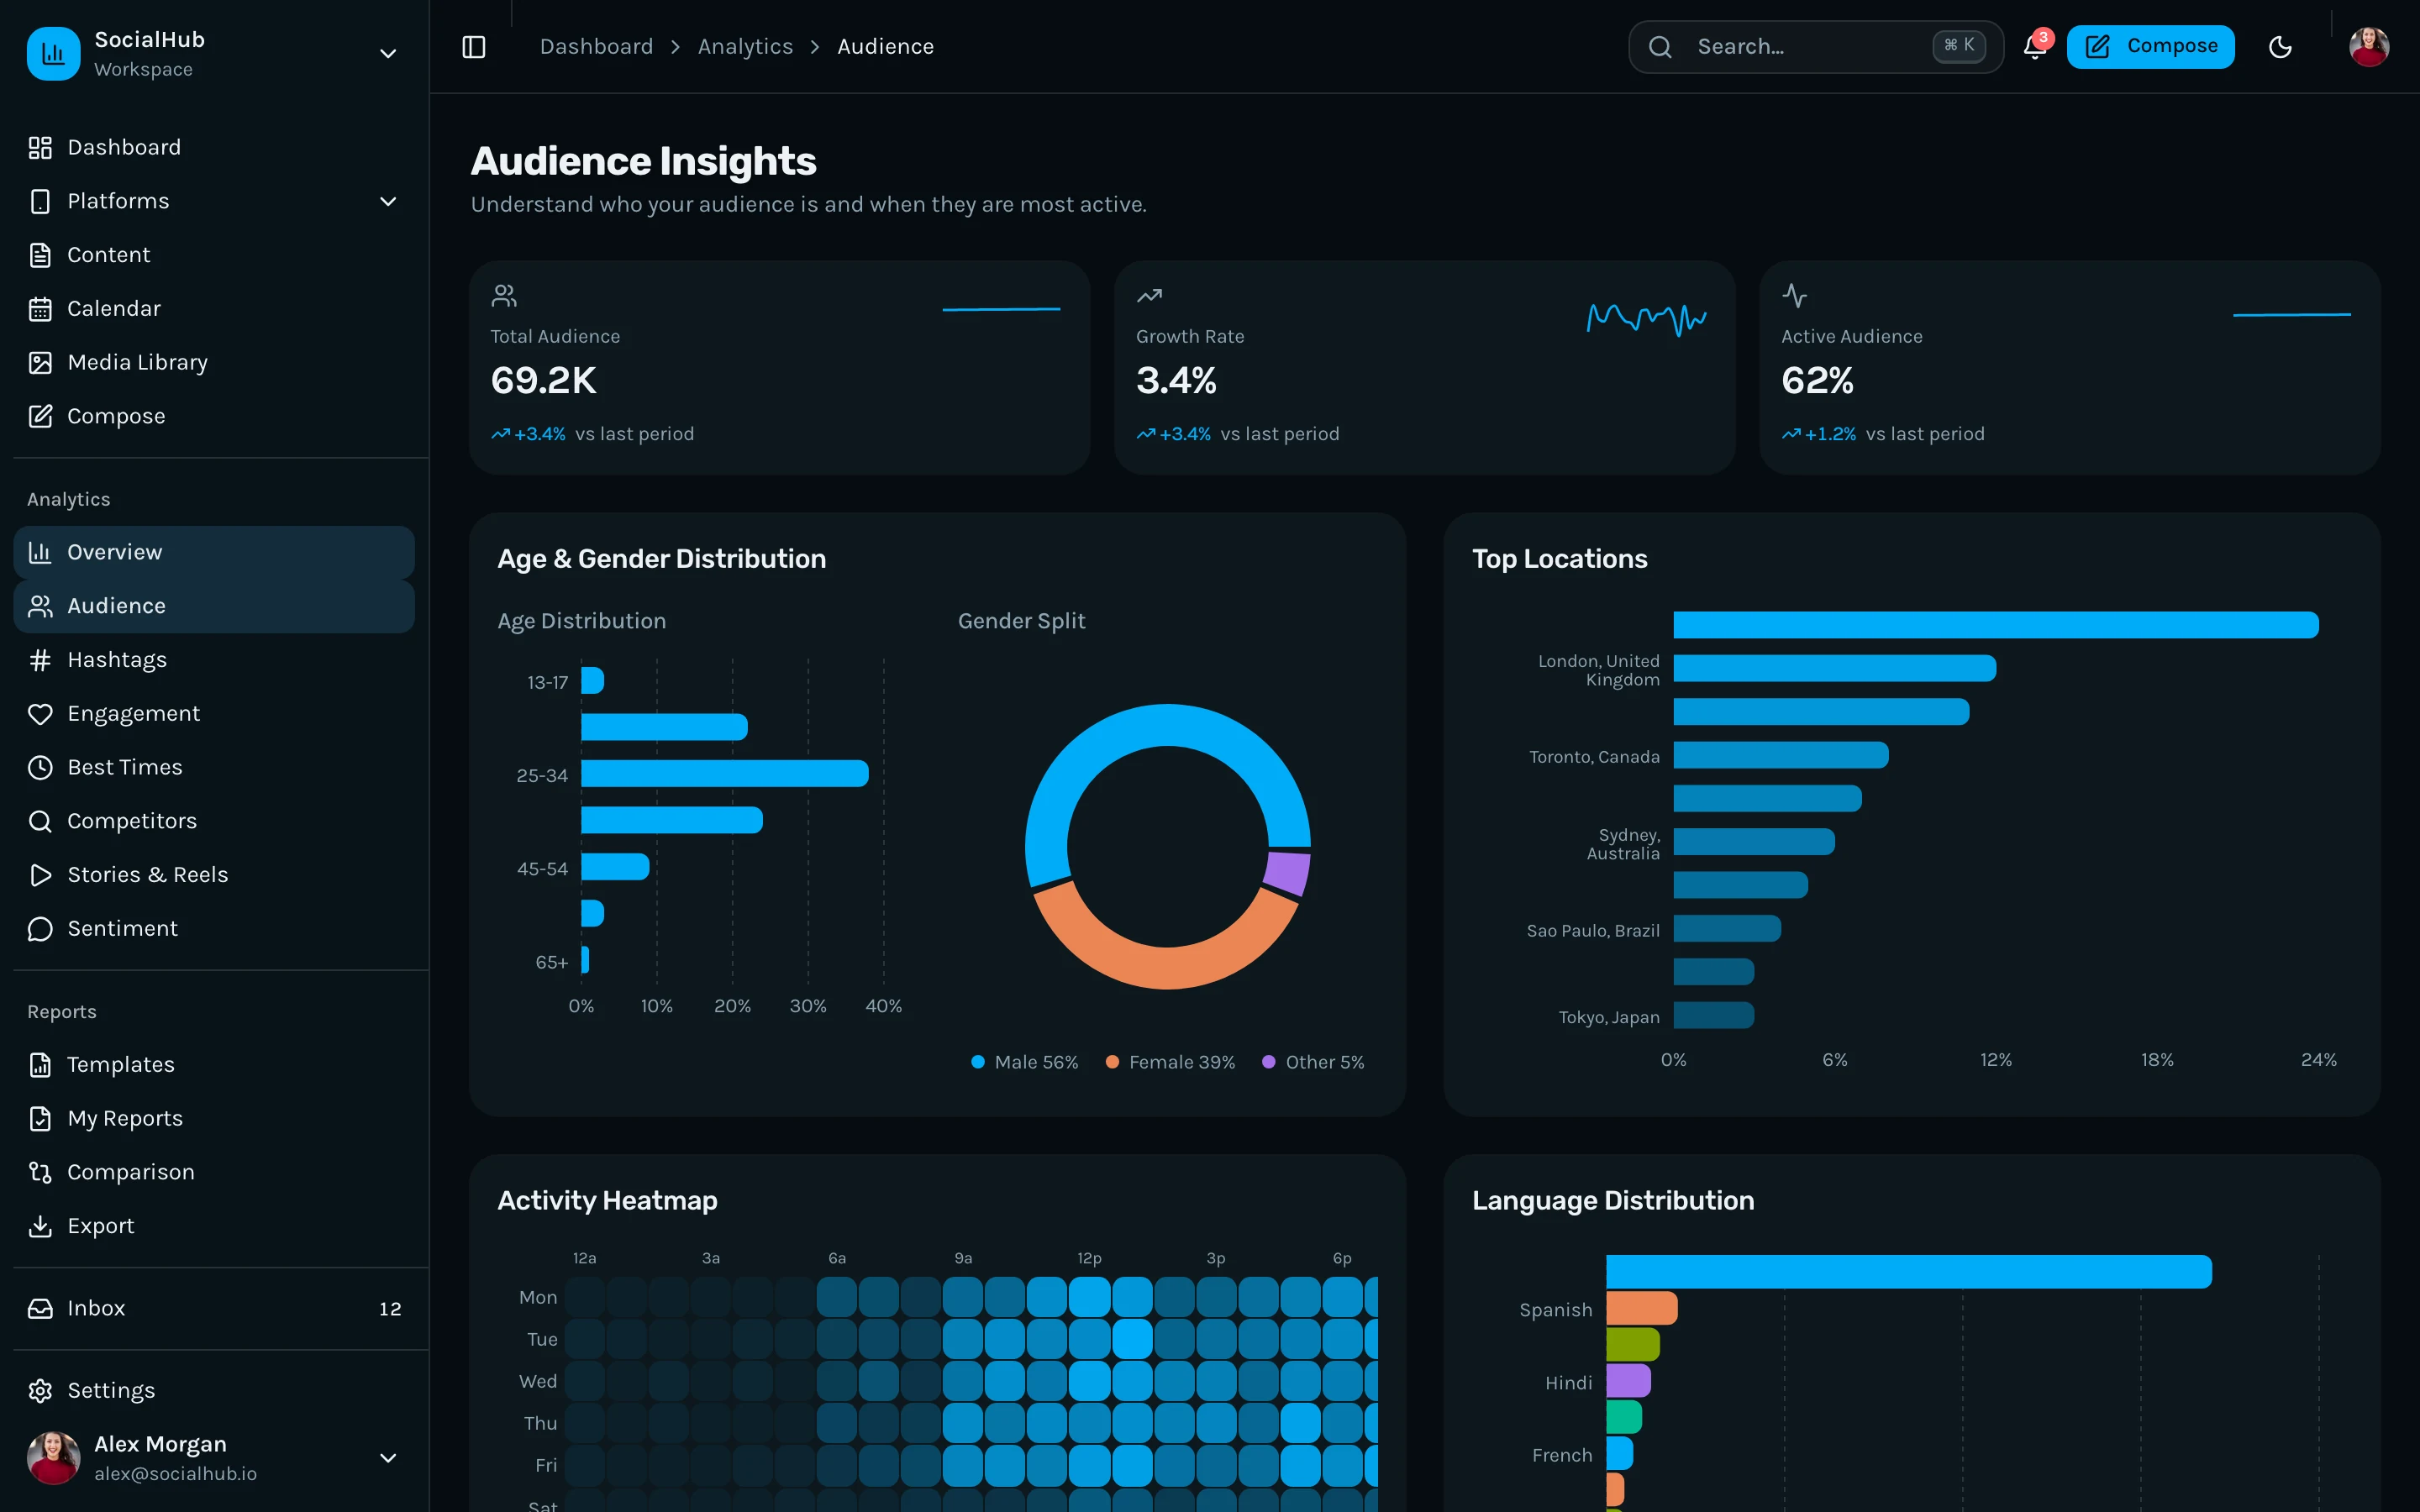
Social media analytics is the most data-intensive part of any social media management tool. You need to display metrics from 6+ platforms in a unified view, show trends over time, break down audience demographics, track competitor performance, and generate reports that clients or leadership can understand. Building these dashboards from scratch means designing chart layouts, integrating a charting library, handling time-series data, building filter controls, and making everything responsive. This social media analytics template handles the frontend. Multi-platform analytics for Instagram, Twitter/X, Facebook, LinkedIn, TikTok, and YouTube with unified overview and per-platform deep dives. Follower growth charts, engagement rate trends, impressions and reach over time, post performance rankings, and best posting time heatmaps. Audience demographic dashboards with age, gender, location, and active hours. Sentiment analysis views. Competitor tracking with benchmarking. Hashtag analytics. Story and reel performance. All built with Recharts and styled to match the Tailwind design token system. Every chart, table, and dashboard is WCAG AA accessible with text alternatives for charts and keyboard-navigable data tables.
Key Features
Unified Analytics Dashboard
Cross-platform metrics in a single view. Follower totals, engagement rates, impressions, and reach aggregated across all connected platforms.
Per-Platform Deep Dives
Dedicated analytics pages for Instagram, Twitter/X, Facebook, LinkedIn, TikTok, and YouTube with platform-specific metrics and visualizations.
Audience Demographics
Age, gender, location, language, and active hours across platforms. Visual breakdowns to inform content strategy.
Competitor Tracking
Monitor competitor accounts with follower growth comparisons, posting frequency analysis, and engagement benchmarks.
Sentiment Analysis
Track audience sentiment across comments and mentions with positive, negative, and neutral breakdowns over time.
Reports & Export
Pre-built report layouts with date range filters, platform selection, and export functionality for stakeholder presentations.
How thefrontkit Compares
| Feature | thefrontkit | Typical Alternatives |
|---|---|---|
| Platforms | 6 platforms with unified + per-platform views | 1-3 platforms, no unified view |
| Chart Library | Recharts matched to design system | Mismatched third-party charts |
| Audience Insights | Demographics, active hours, location | Basic follower counts |
| Reporting | Export-ready report layouts | Screenshot-only |
| Accessibility | Chart text alternatives, keyboard nav | Charts inaccessible |
| Price | From $131 (includes full dashboard) | $49-$299 |
Ready to Ship Faster?
Skip the boilerplate and start building what matters. Production-ready, accessible, and token-synced.
View Social Media Dashboard Template →Related Resources
Need it built, not just a kit?
The team behind thefrontkit does done-for-you launches and custom builds. Fixed quotes, most projects live in 2-4 weeks, from $1999.
Frequently Asked Questions
Follower growth, engagement rates, impressions, reach, post performance, audience demographics, active hours, sentiment, competitor metrics, and hashtag analytics. Each platform gets a dedicated dashboard with platform-specific metrics.
This is part of the full Social Media Dashboard Template which also includes a content calendar, post composer, social inbox, and settings. The analytics dashboards are the core, but you get the complete management tool.
All charts are built with Recharts, styled to match the Tailwind CSS design token system. This means charts automatically adapt to your brand colors and support both light and dark themes.
Yes. All charts include text alternatives for screen readers. Data tables have proper column headers and keyboard navigation. The entire dashboard is WCAG AA compliant.