SalesPulse — Sales Performance Dashboard for Next.js
Most sales dashboards get built by engineers, reviewed by the VP of Sales, and ignored by the reps who were supposed to use them. The data is there, but the answer to what should I do today isn't. This kit gives sales leaders, founders, and agencies 20 screens across 3 sections: a visual pipeline with drag-and-drop deal stages, deals, contacts and accounts, sequences, quota targets and territories, commissions, a rep leaderboard with coaching, and analytics and revenue reports. Built so reps will actually check it in the morning.
Starting at $79$13140% OFF· 7-day money-back guarantee
Or get this + all 18 kits for $749 with All UI Kits →
Last updated on August 25, 2026


20 Screens Across 3 Sections
Everything you need to build a complete sales performance platform — from pipeline visualization to quota tracking, leaderboards, and revenue reporting.

Dashboard with revenue and quota metrics, drag-and-drop pipeline, deals, contacts, accounts with detail view, and products

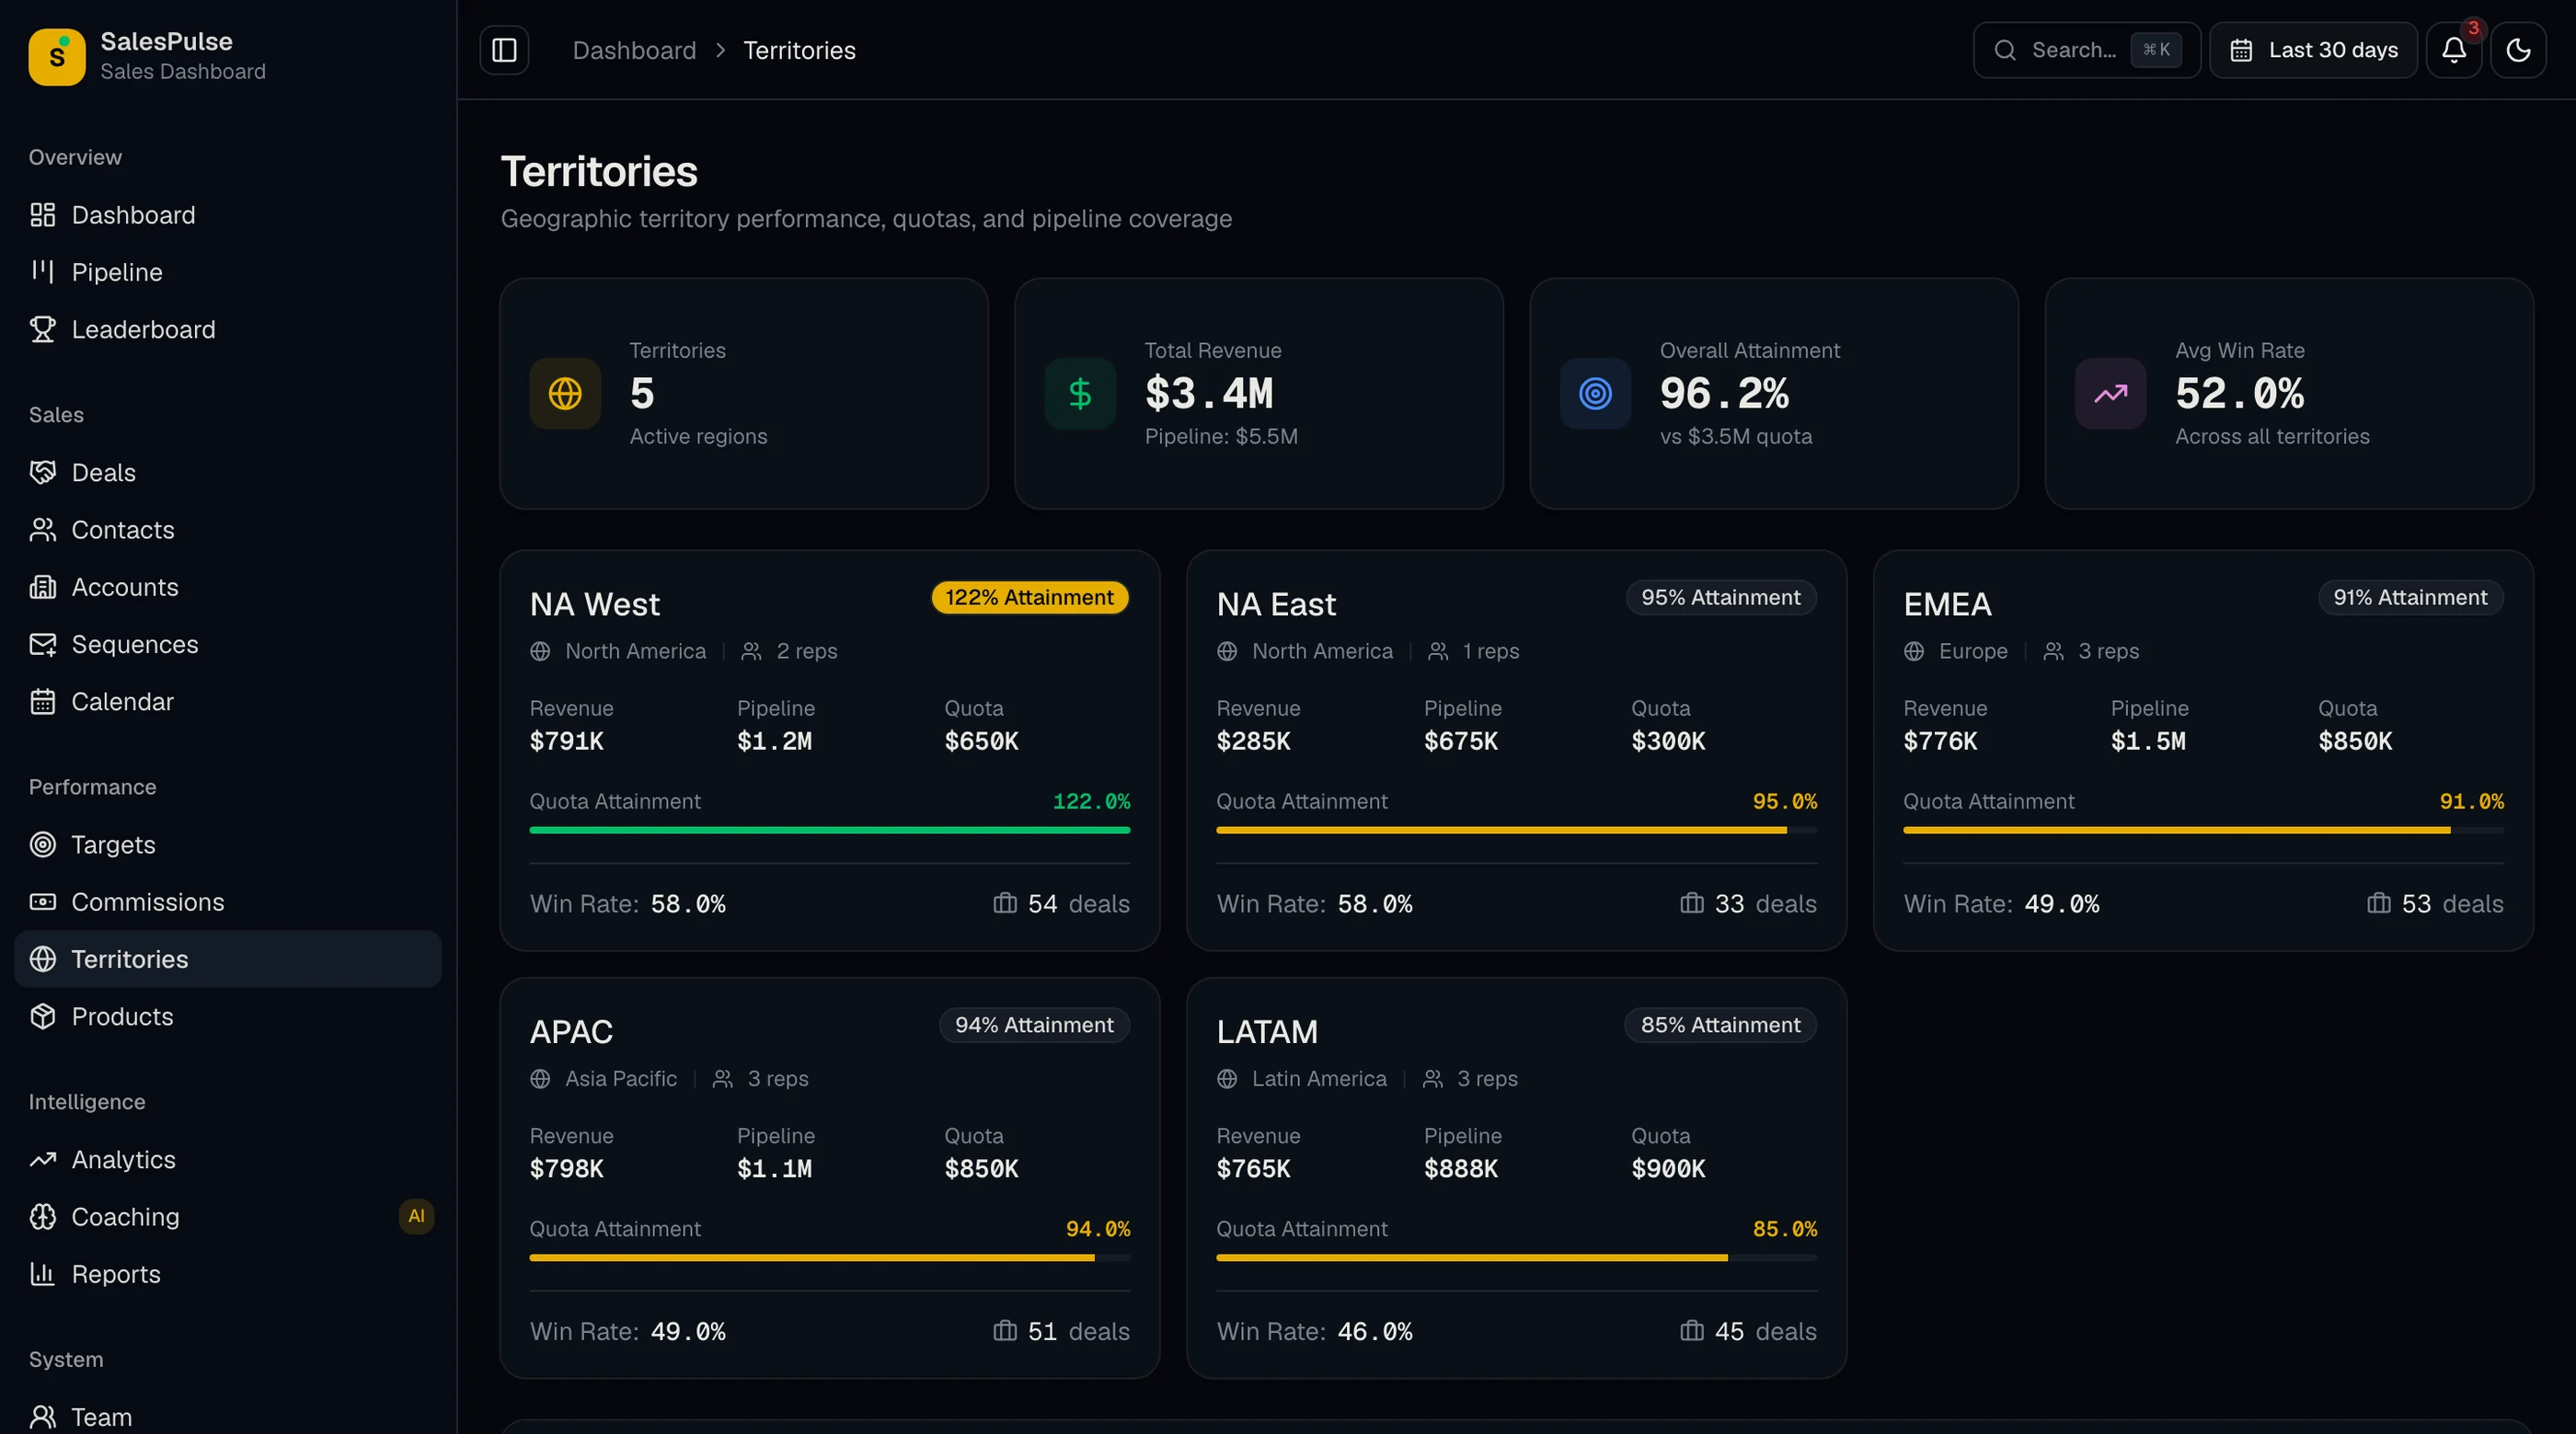
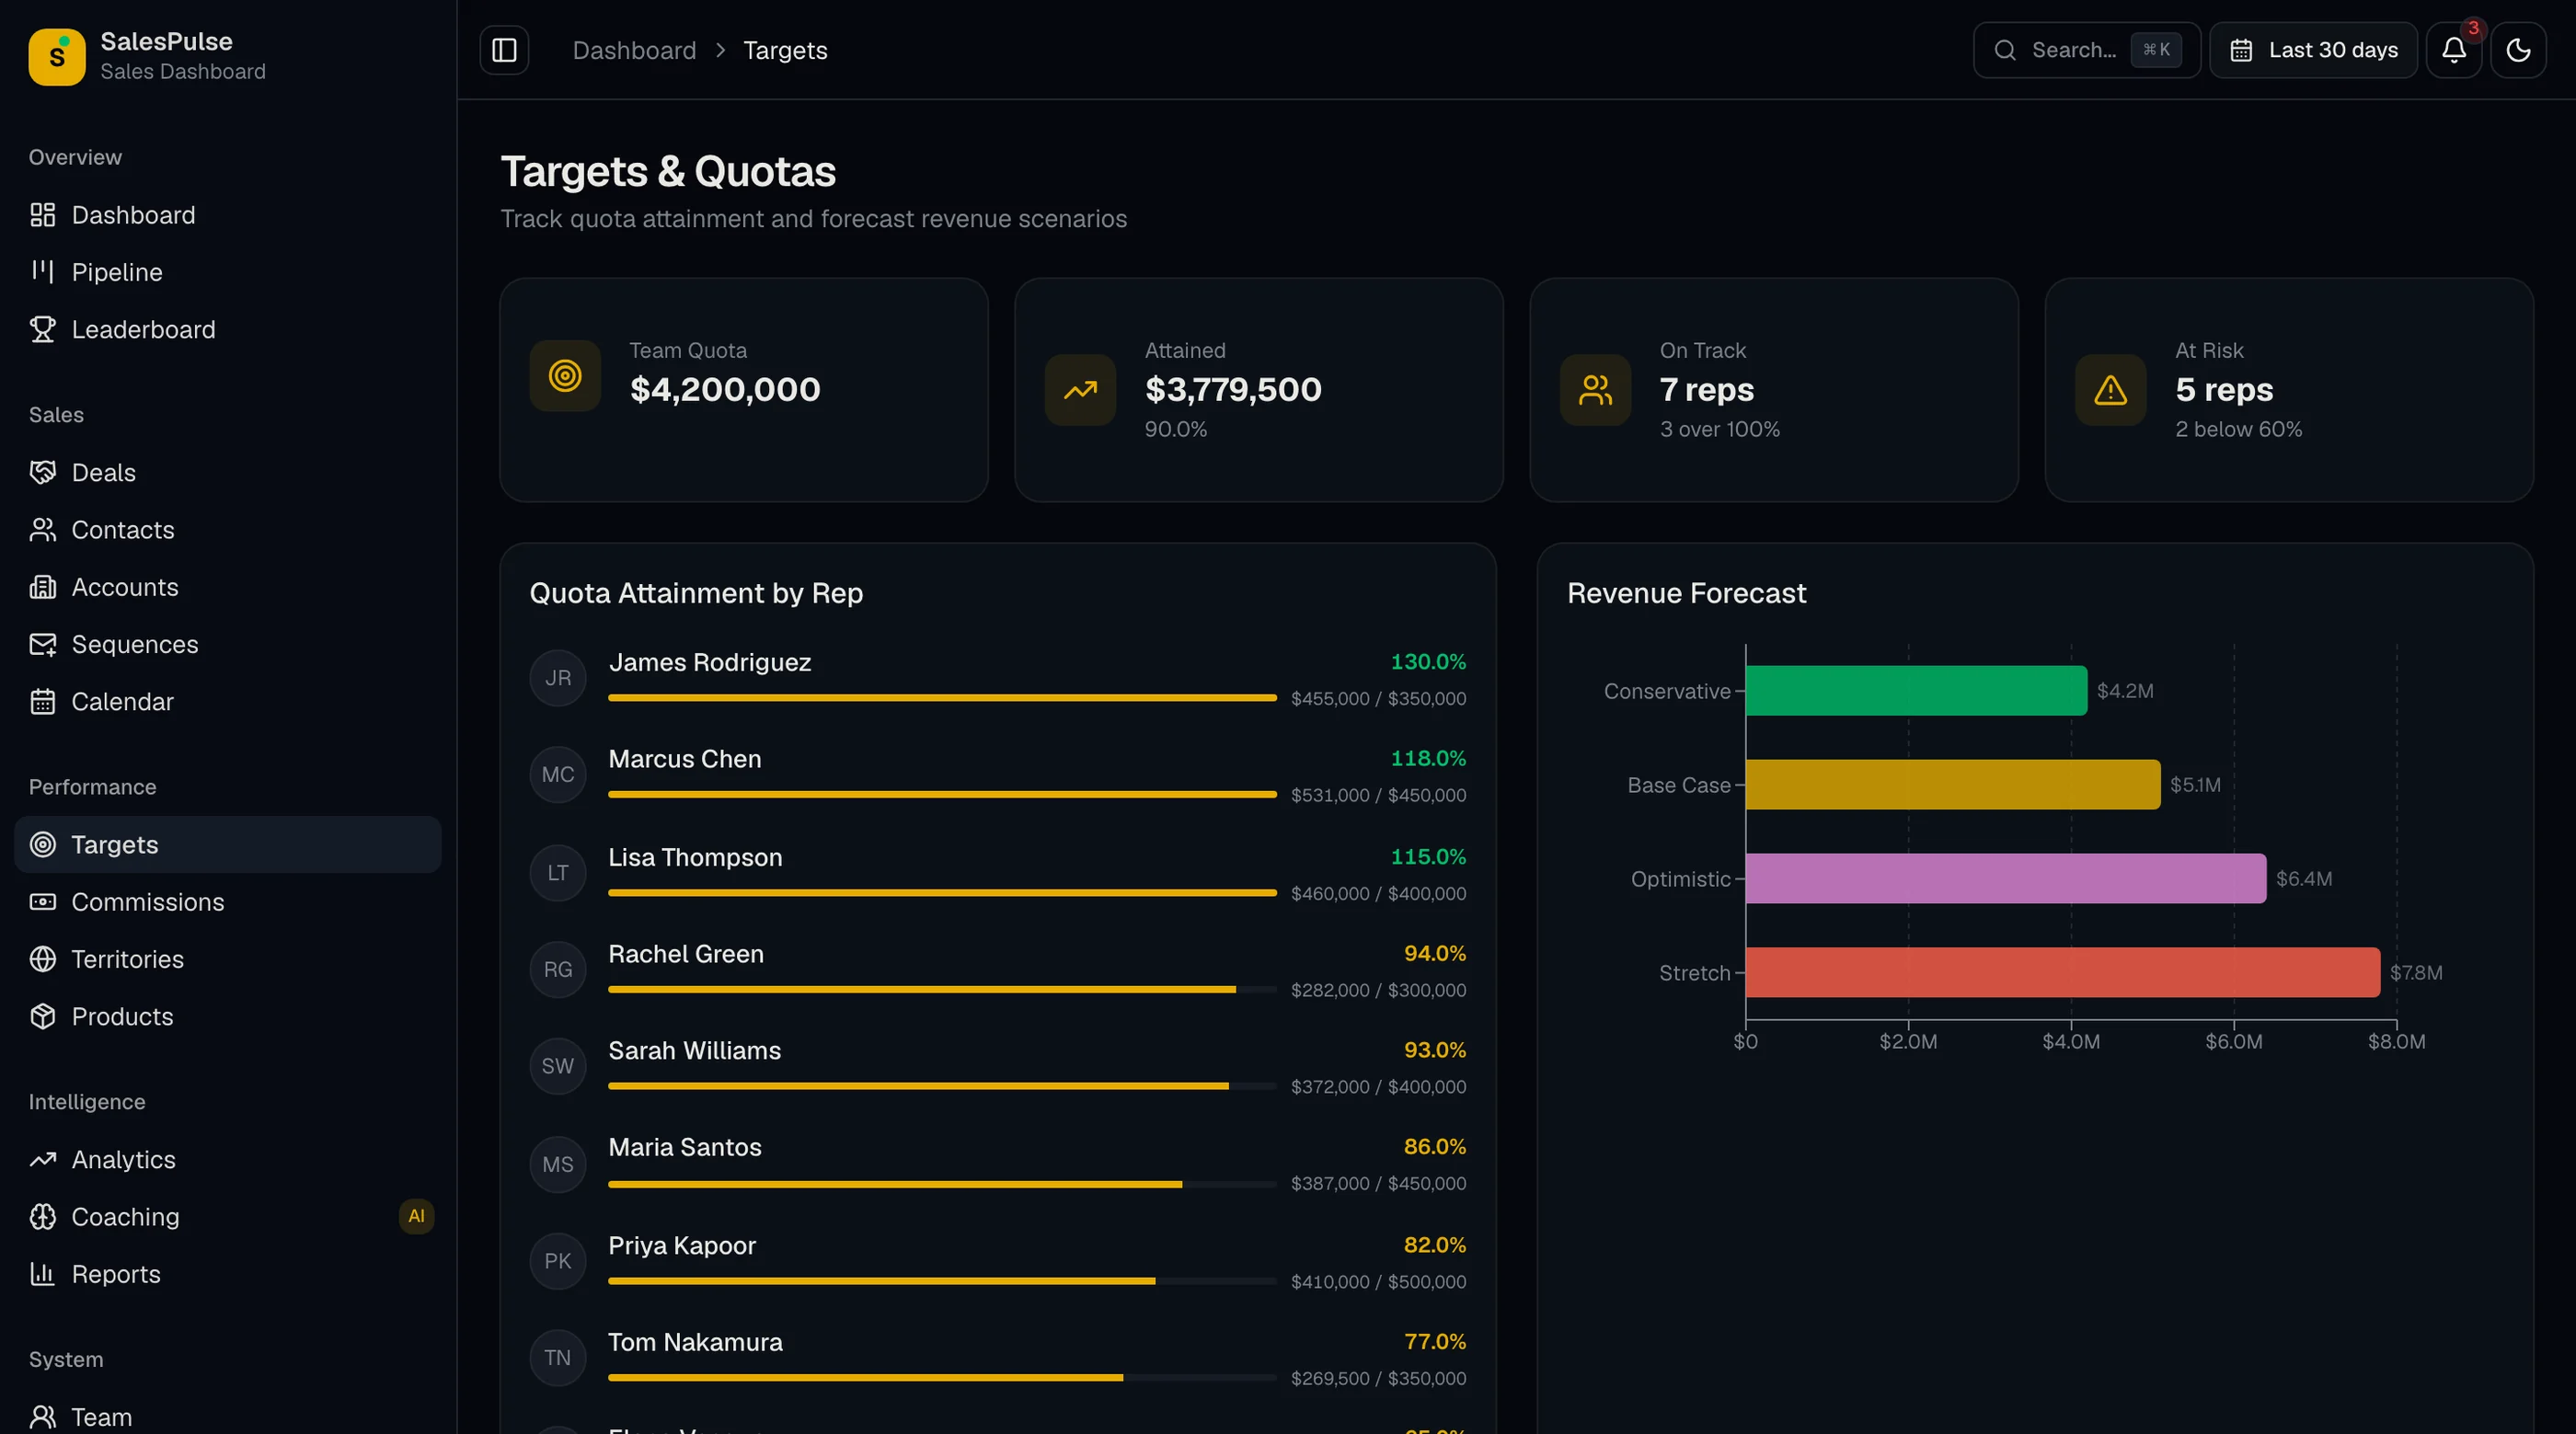
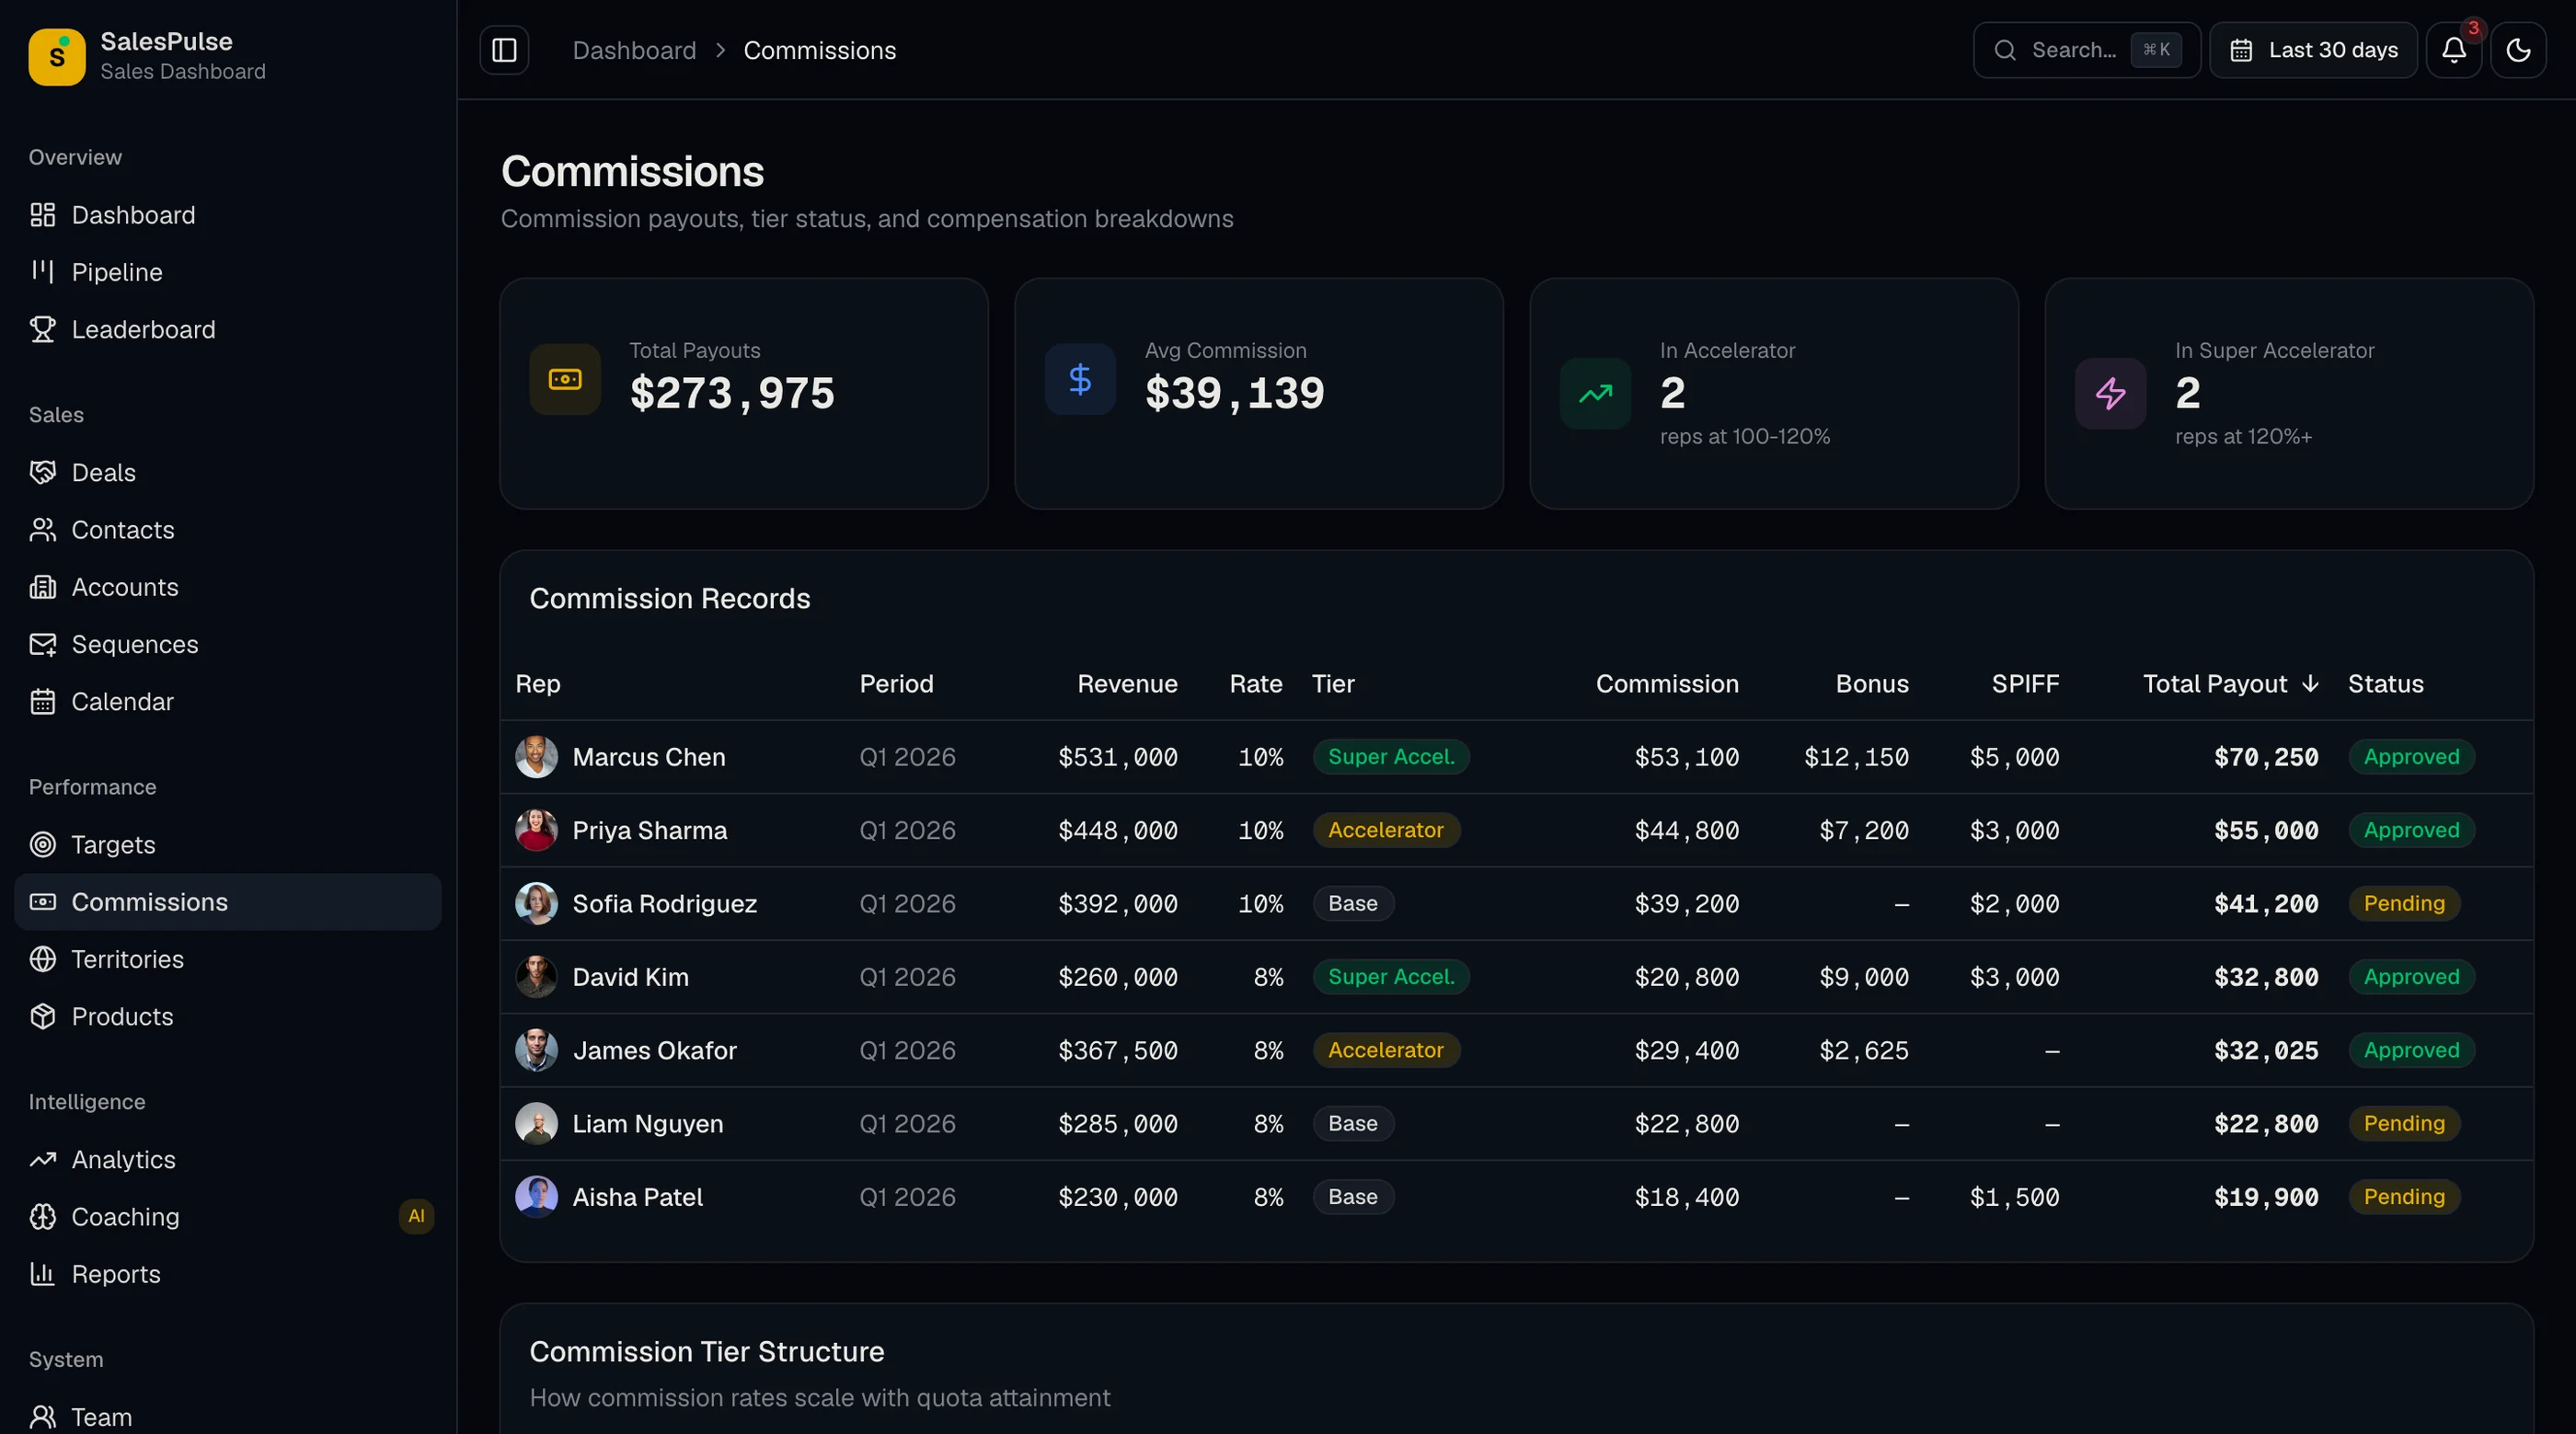
Quota targets, territories, commissions, rep leaderboard, coaching, analytics, and revenue reports

Sequences, calendar, team, settings, and login and register pages
All built with TailwindCSS and shadcn/ui. Accessible, token-driven, and developer-friendly.
Built on a Solid Foundation
Every component follows production-grade patterns for accessibility, responsiveness, and maintainability.

Pipeline & Deals
- Visual pipeline board with drag-drop deal stages
- Deal cards with values, probability, and close dates
- Deal detail views with activity timeline
- Conversion funnel visualization
- Stage-level revenue summaries and weighted totals

Targets & Performance
- Individual and team quota progress tracking
- Attainment percentage gauges and trend charts
- Sales rep leaderboard with ranked performance
- Revenue-based and deal-based metric comparison
- Period filtering for monthly, quarterly, annual views

Reports & Analytics
- Revenue trend charts with period comparisons
- Win rate analysis and pipeline velocity metrics
- Forecast vs. actual revenue charts
- KPI dashboard with conversion funnels
- Quota attainment summaries for sales leadership
20 screens, 3 layouts, 30+ components — everything you need to ship a complete sales performance dashboard.
View all screensWhat's Included in This Sales Dashboard Kit
Included
 React + Tailwind code for all 20 screens and components
- oklch design tokens powering forecast confidence bands, win-rate badges, and rep-rank colors
- Visual pipeline board with drag-drop deal stages
- 5 Recharts dashboards with revenue, funnel, and forecast charts
- Responsive layouts that fit a phone on the rep in the field and a 4K screen at the SDR desk
- 1 year of updates
Not Included
- Backend, database, or API logic
- CRM or sales platform integrations
- Authentication or user management backend
- Email notification service
Intent: you get a production-grade sales dashboard UI. You connect your own data source, APIs, and business logic.
Built for SaaS Sales Leaders, B2B Startups, and Agencies

SaaS sales leaders building a custom CRM dashboard or revenue analytics platform on Next.js

Agencies delivering sales dashboards and CRM portals for clients on tight timelines

B2B startups that need a custom sales dashboard without vendor lock-in to Salesforce or HubSpot
Note: This is a frontend UI kit — not a hosted CRM platform. You bring your own backend, database, and API.
Key Features
| Feature | Description |
|---|---|
| Sales Dashboard & Revenue Metrics | KPI cards for total revenue, deals closed, average deal size, and win rate. Conversion funnel visualization, quota attainment gauges, and monthly revenue trend charts with period comparisons. |
| Visual Sales Pipeline | Kanban-style pipeline board with deal cards organized by stage. Drag-and-drop deal movement, weighted pipeline values per stage, probability indicators, and stage-level revenue summaries. |
| Deal Management | Comprehensive deal list with filtering and sorting. Deal detail views with values, close dates, contact information, activity timeline, and notes. Quick actions for stage updates and deal editing. |
| Target & Quota Tracking | Individual and team sales targets with progress bars and attainment percentages. Quota comparison charts, period-over-period performance trends, and gap-to-target analysis for sales managers. |
| Sales Rep Leaderboard | Ranked sales rep table with revenue generated, deals closed, win rate, and average deal size. Performance badges, trend indicators, and time-period filtering for monthly, quarterly, and annual views. |
| Revenue Reports & Forecasting | Revenue trend charts with monthly and quarterly breakdowns. Win rate analysis, pipeline velocity metrics, forecast vs. actual comparisons, and exportable report views for sales leadership. |
All components are WCAG AA-compliant and optimized for mobile and desktop.
Frontend Stack for the Sales App





- Utility classes from Tailwind across the 20 screens including pipeline, leaderboard, and quota tracker
- Every component aligns with shadcn/ui conventions, so this drops into your existing sales app
- Radix selects on territory pickers, deal stage filters, and rep assignment menus
- oklch tokens that drive forecast bands, win rate badges, and leaderboard ranks consistently
- Recharts integration for revenue trends, conversion funnels, and quota attainment charts
- Visual pipeline board and leaderboard with zero external dependencies
Accessibility Highlights
Every sales workflow is inclusive by design. From pipeline boards to leaderboards and deal forms, built for everyone.
Preview Gallery
Preview the Next.js sales dashboard template screens: pipeline board, targets and quotas, rep leaderboard, account directory, territories, and commissions.
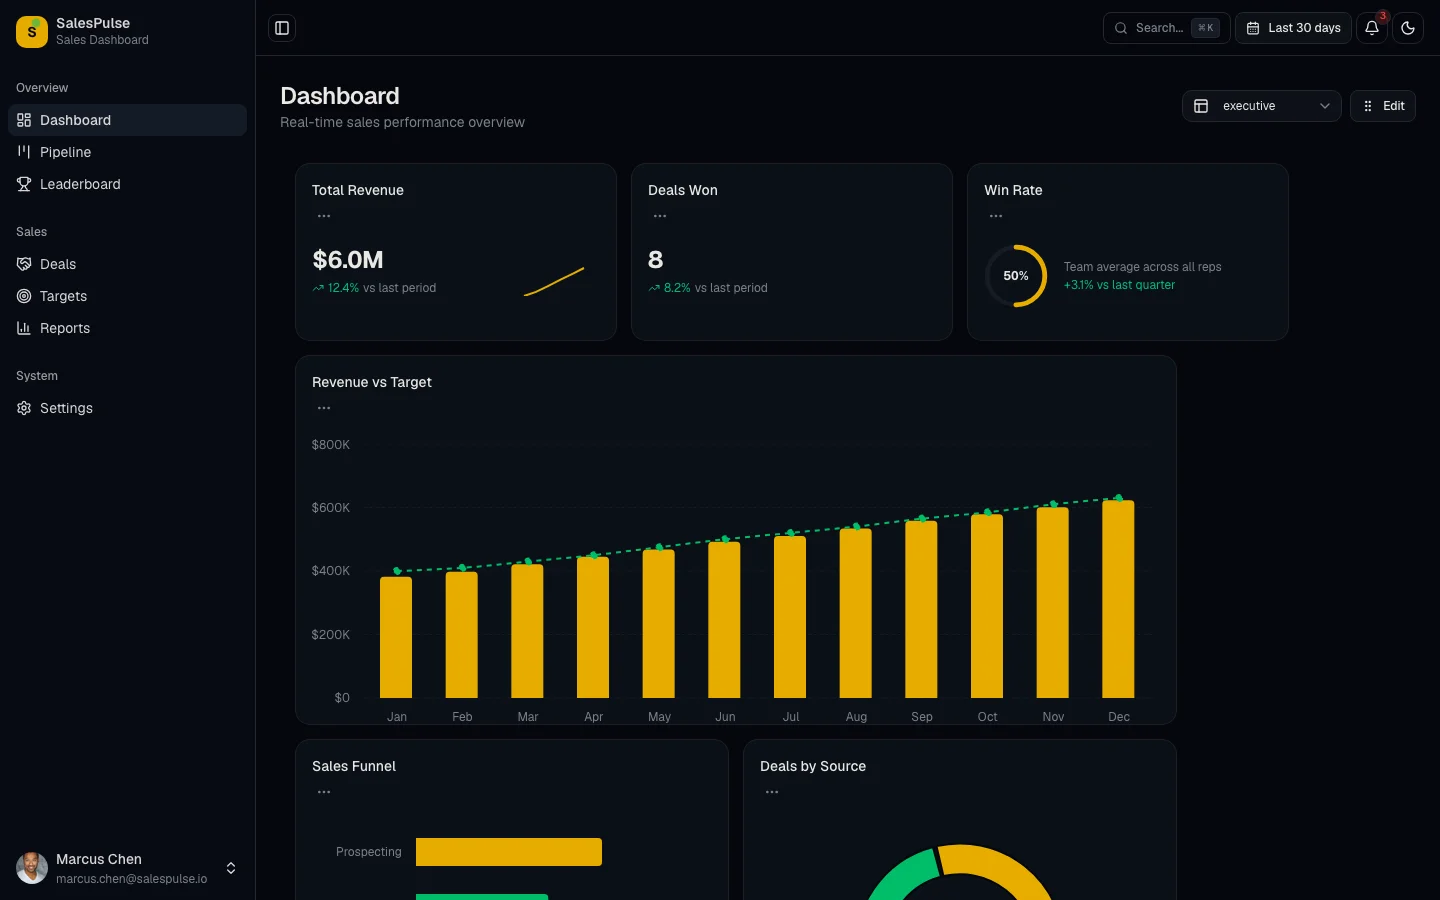
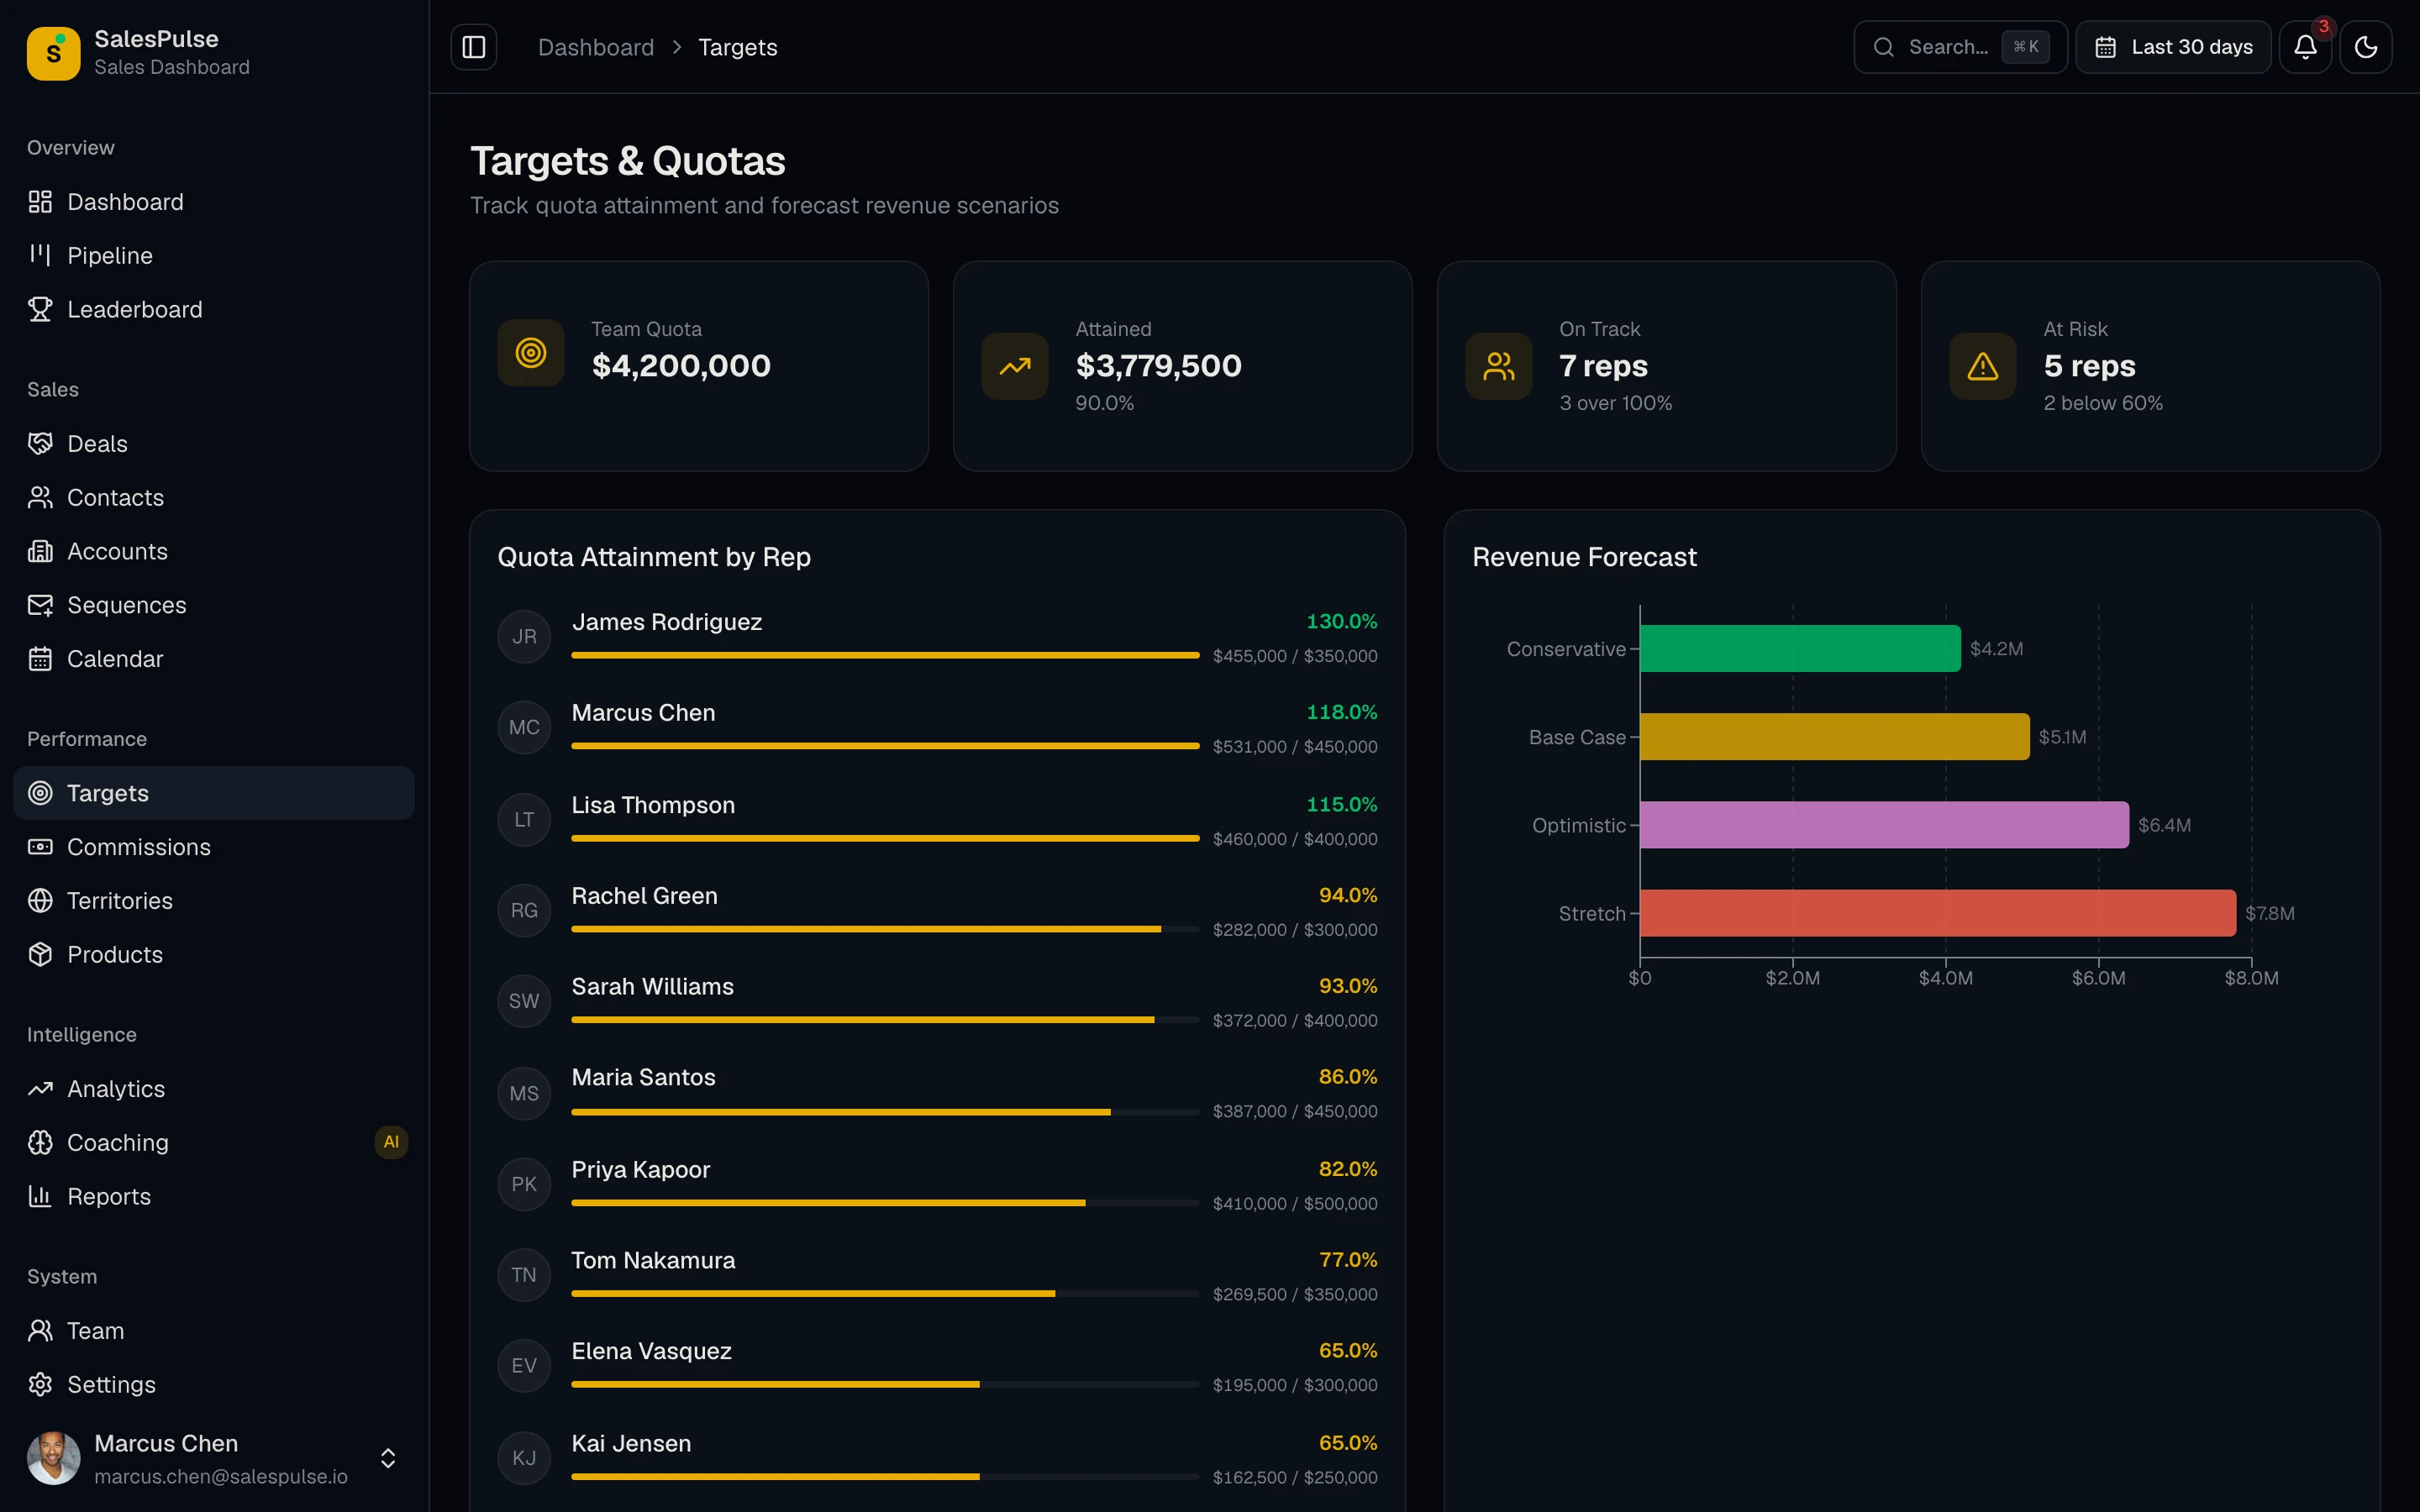
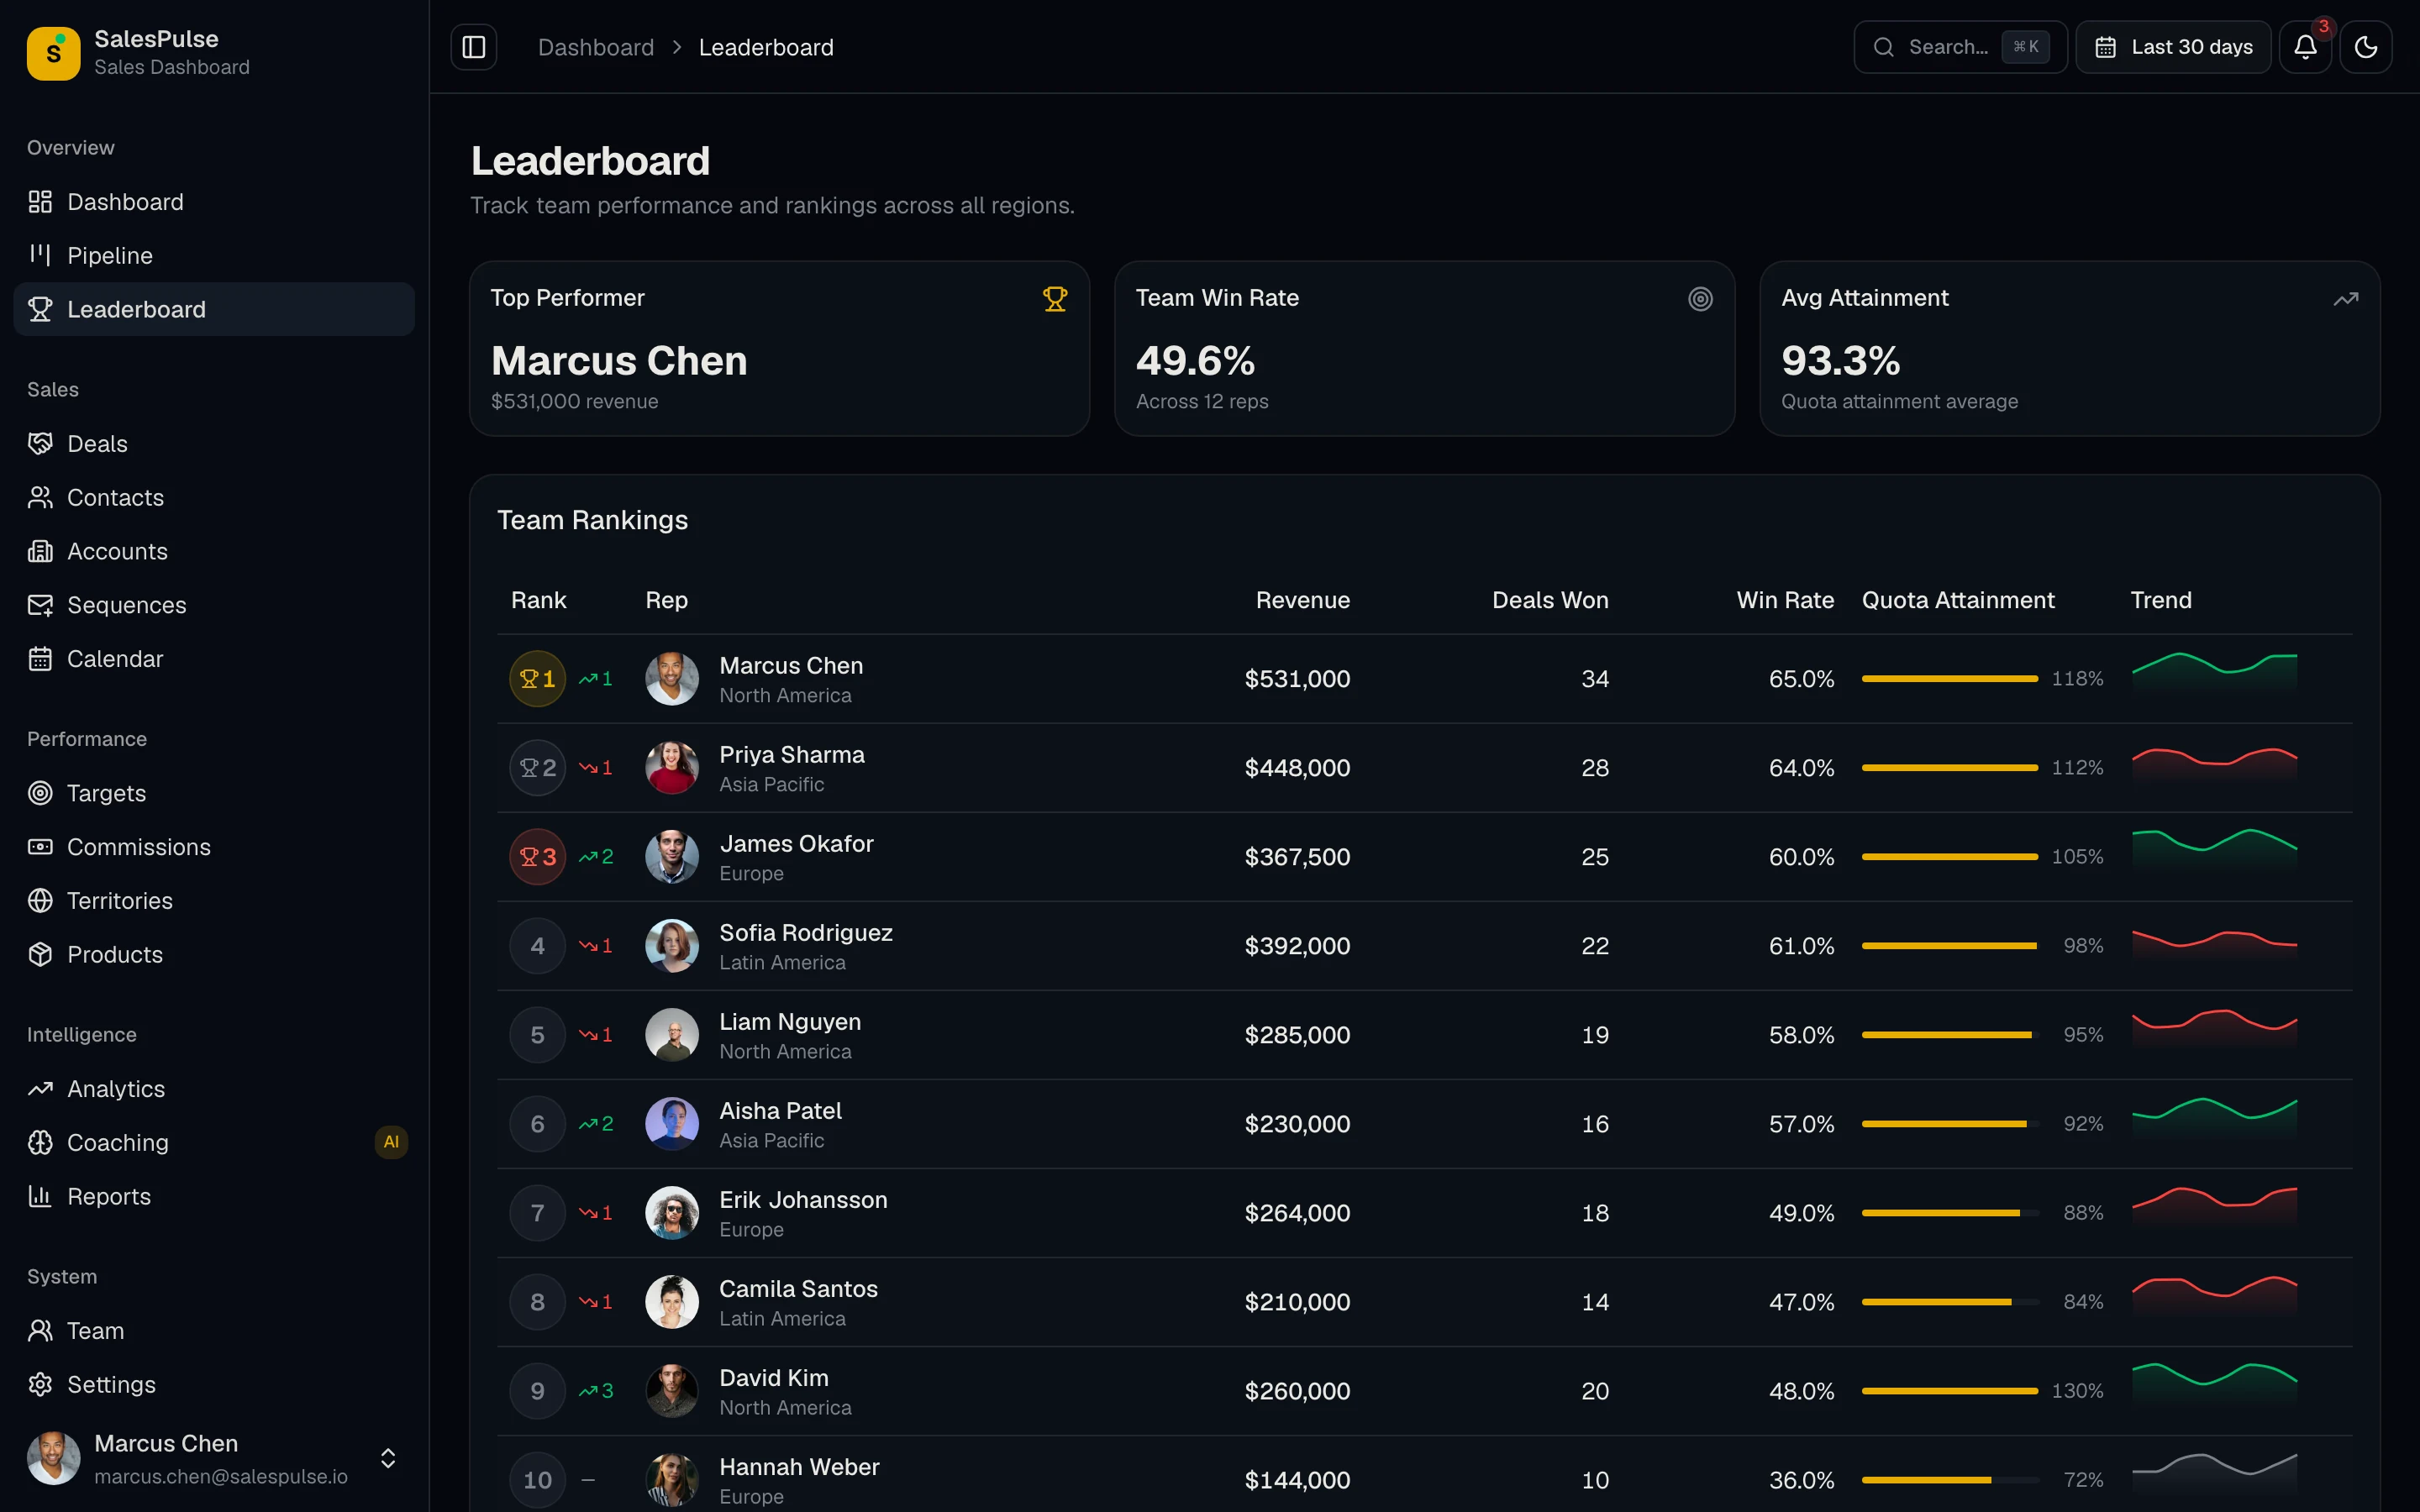
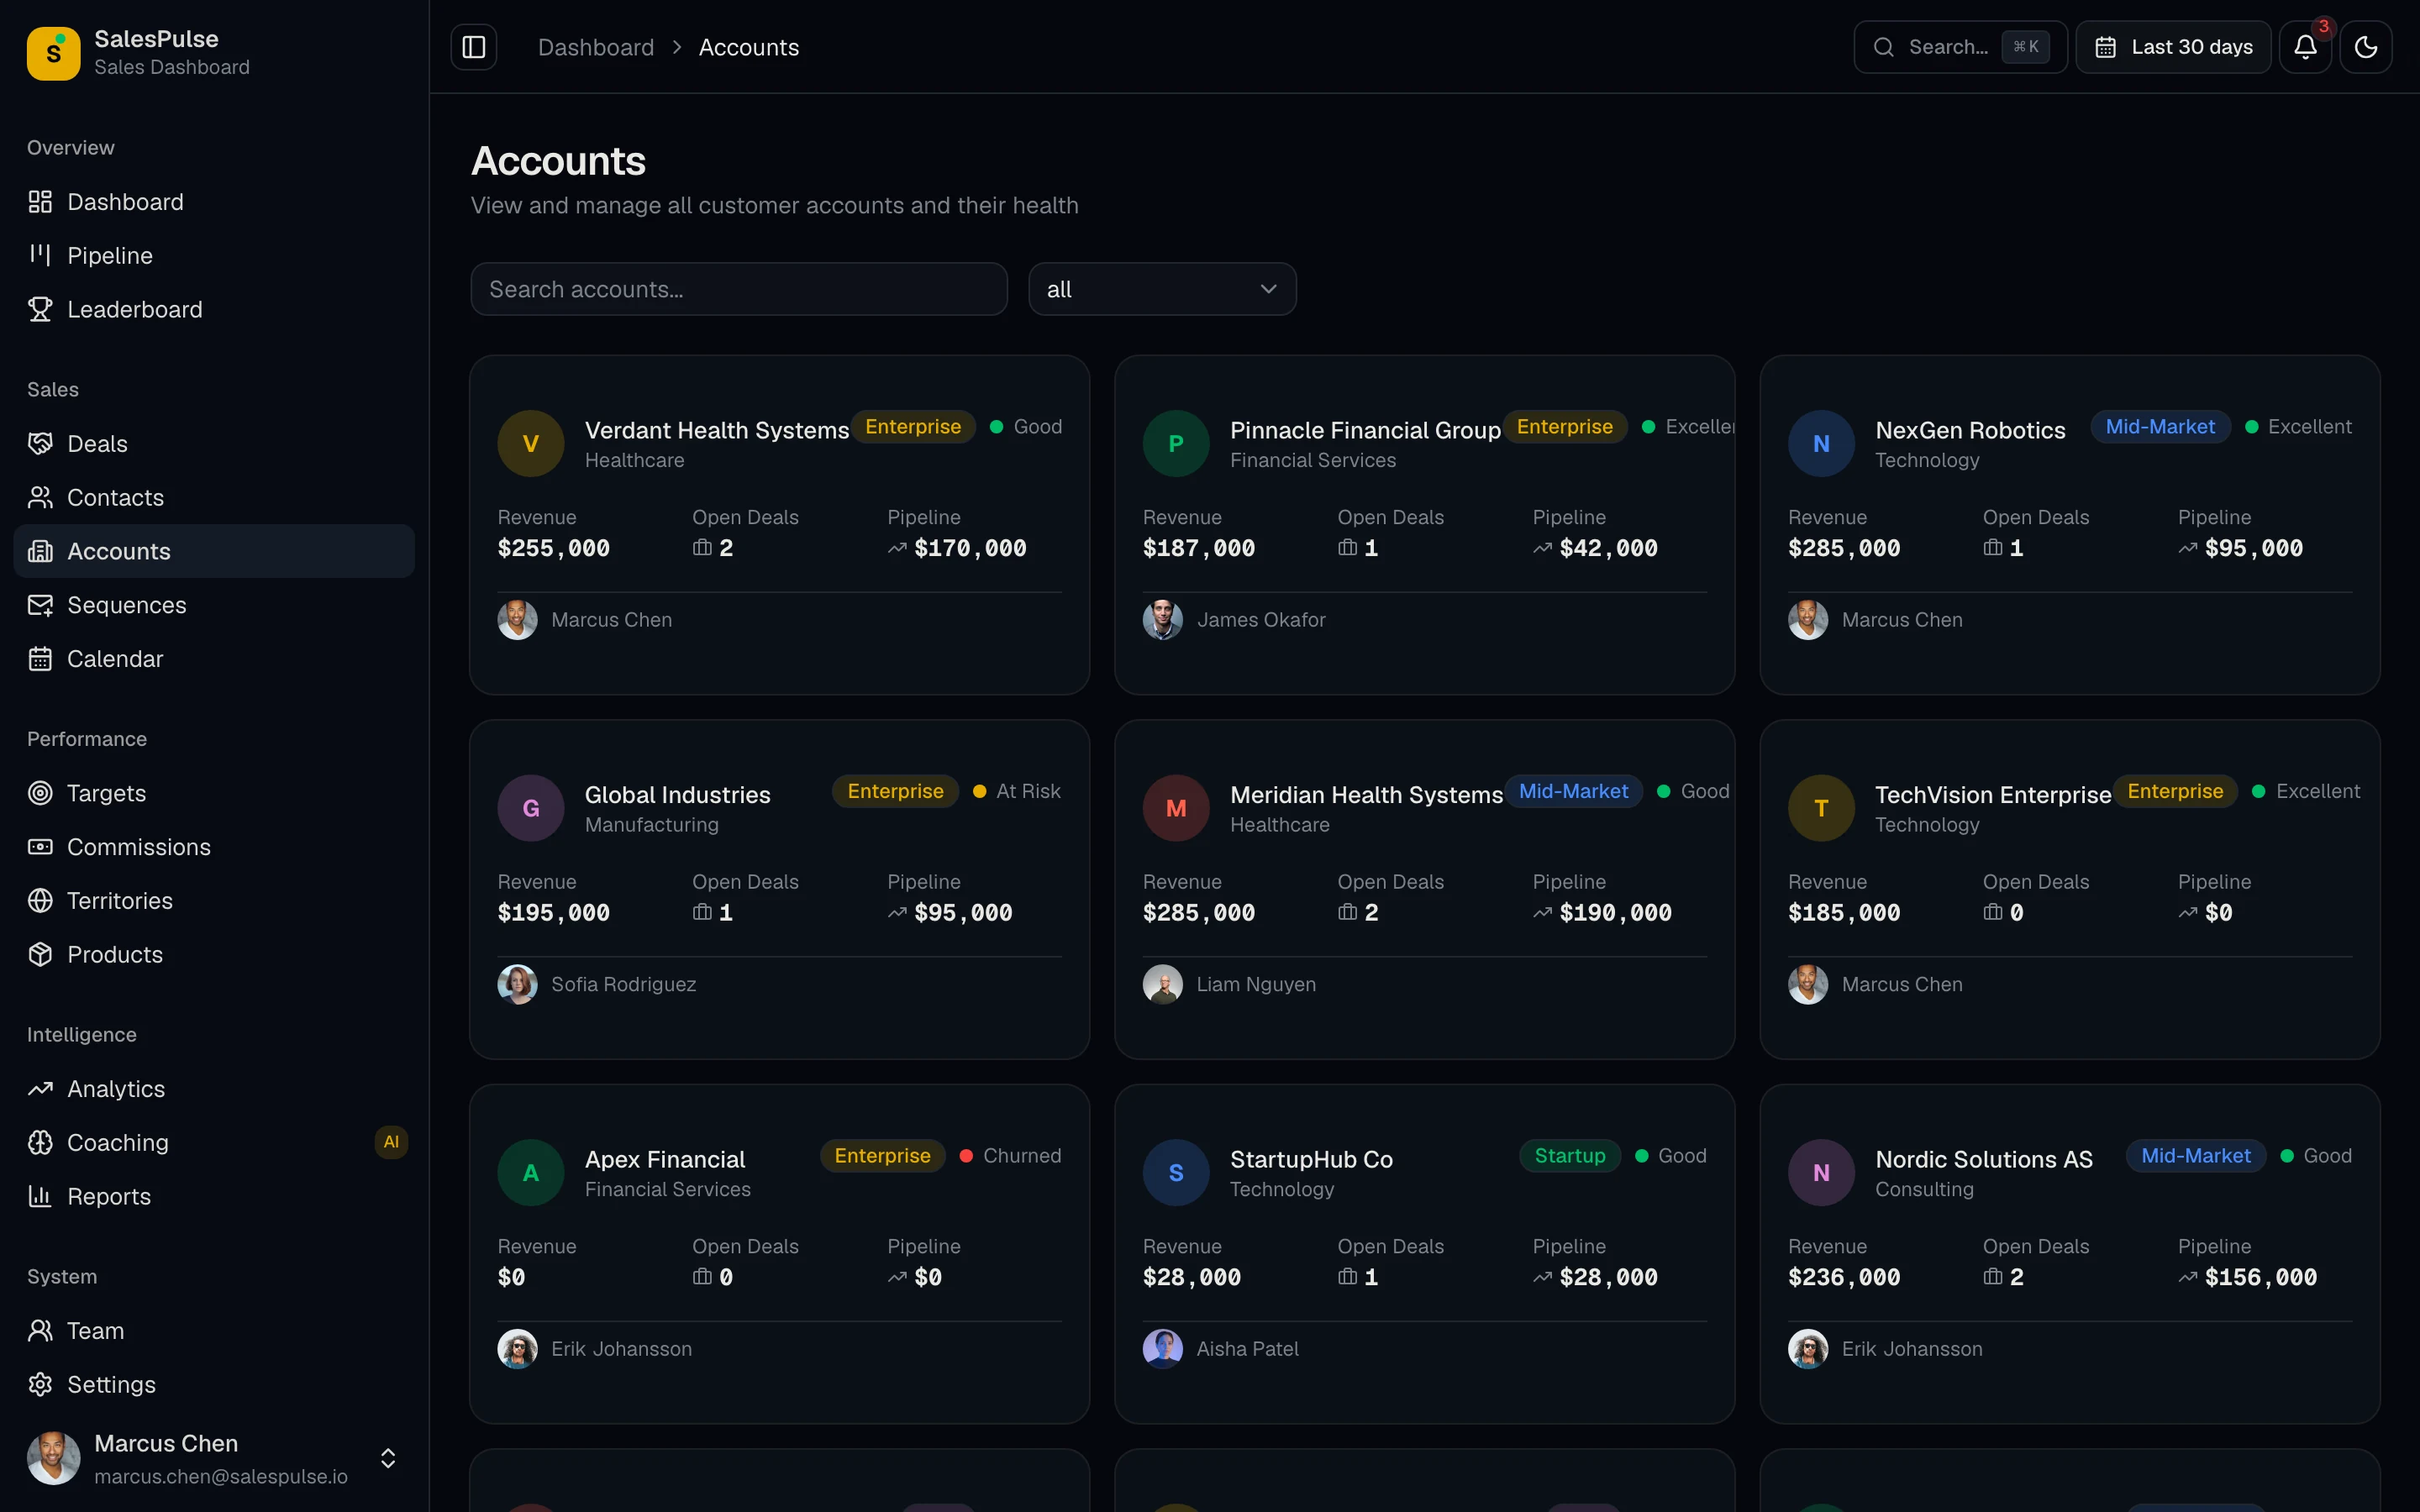
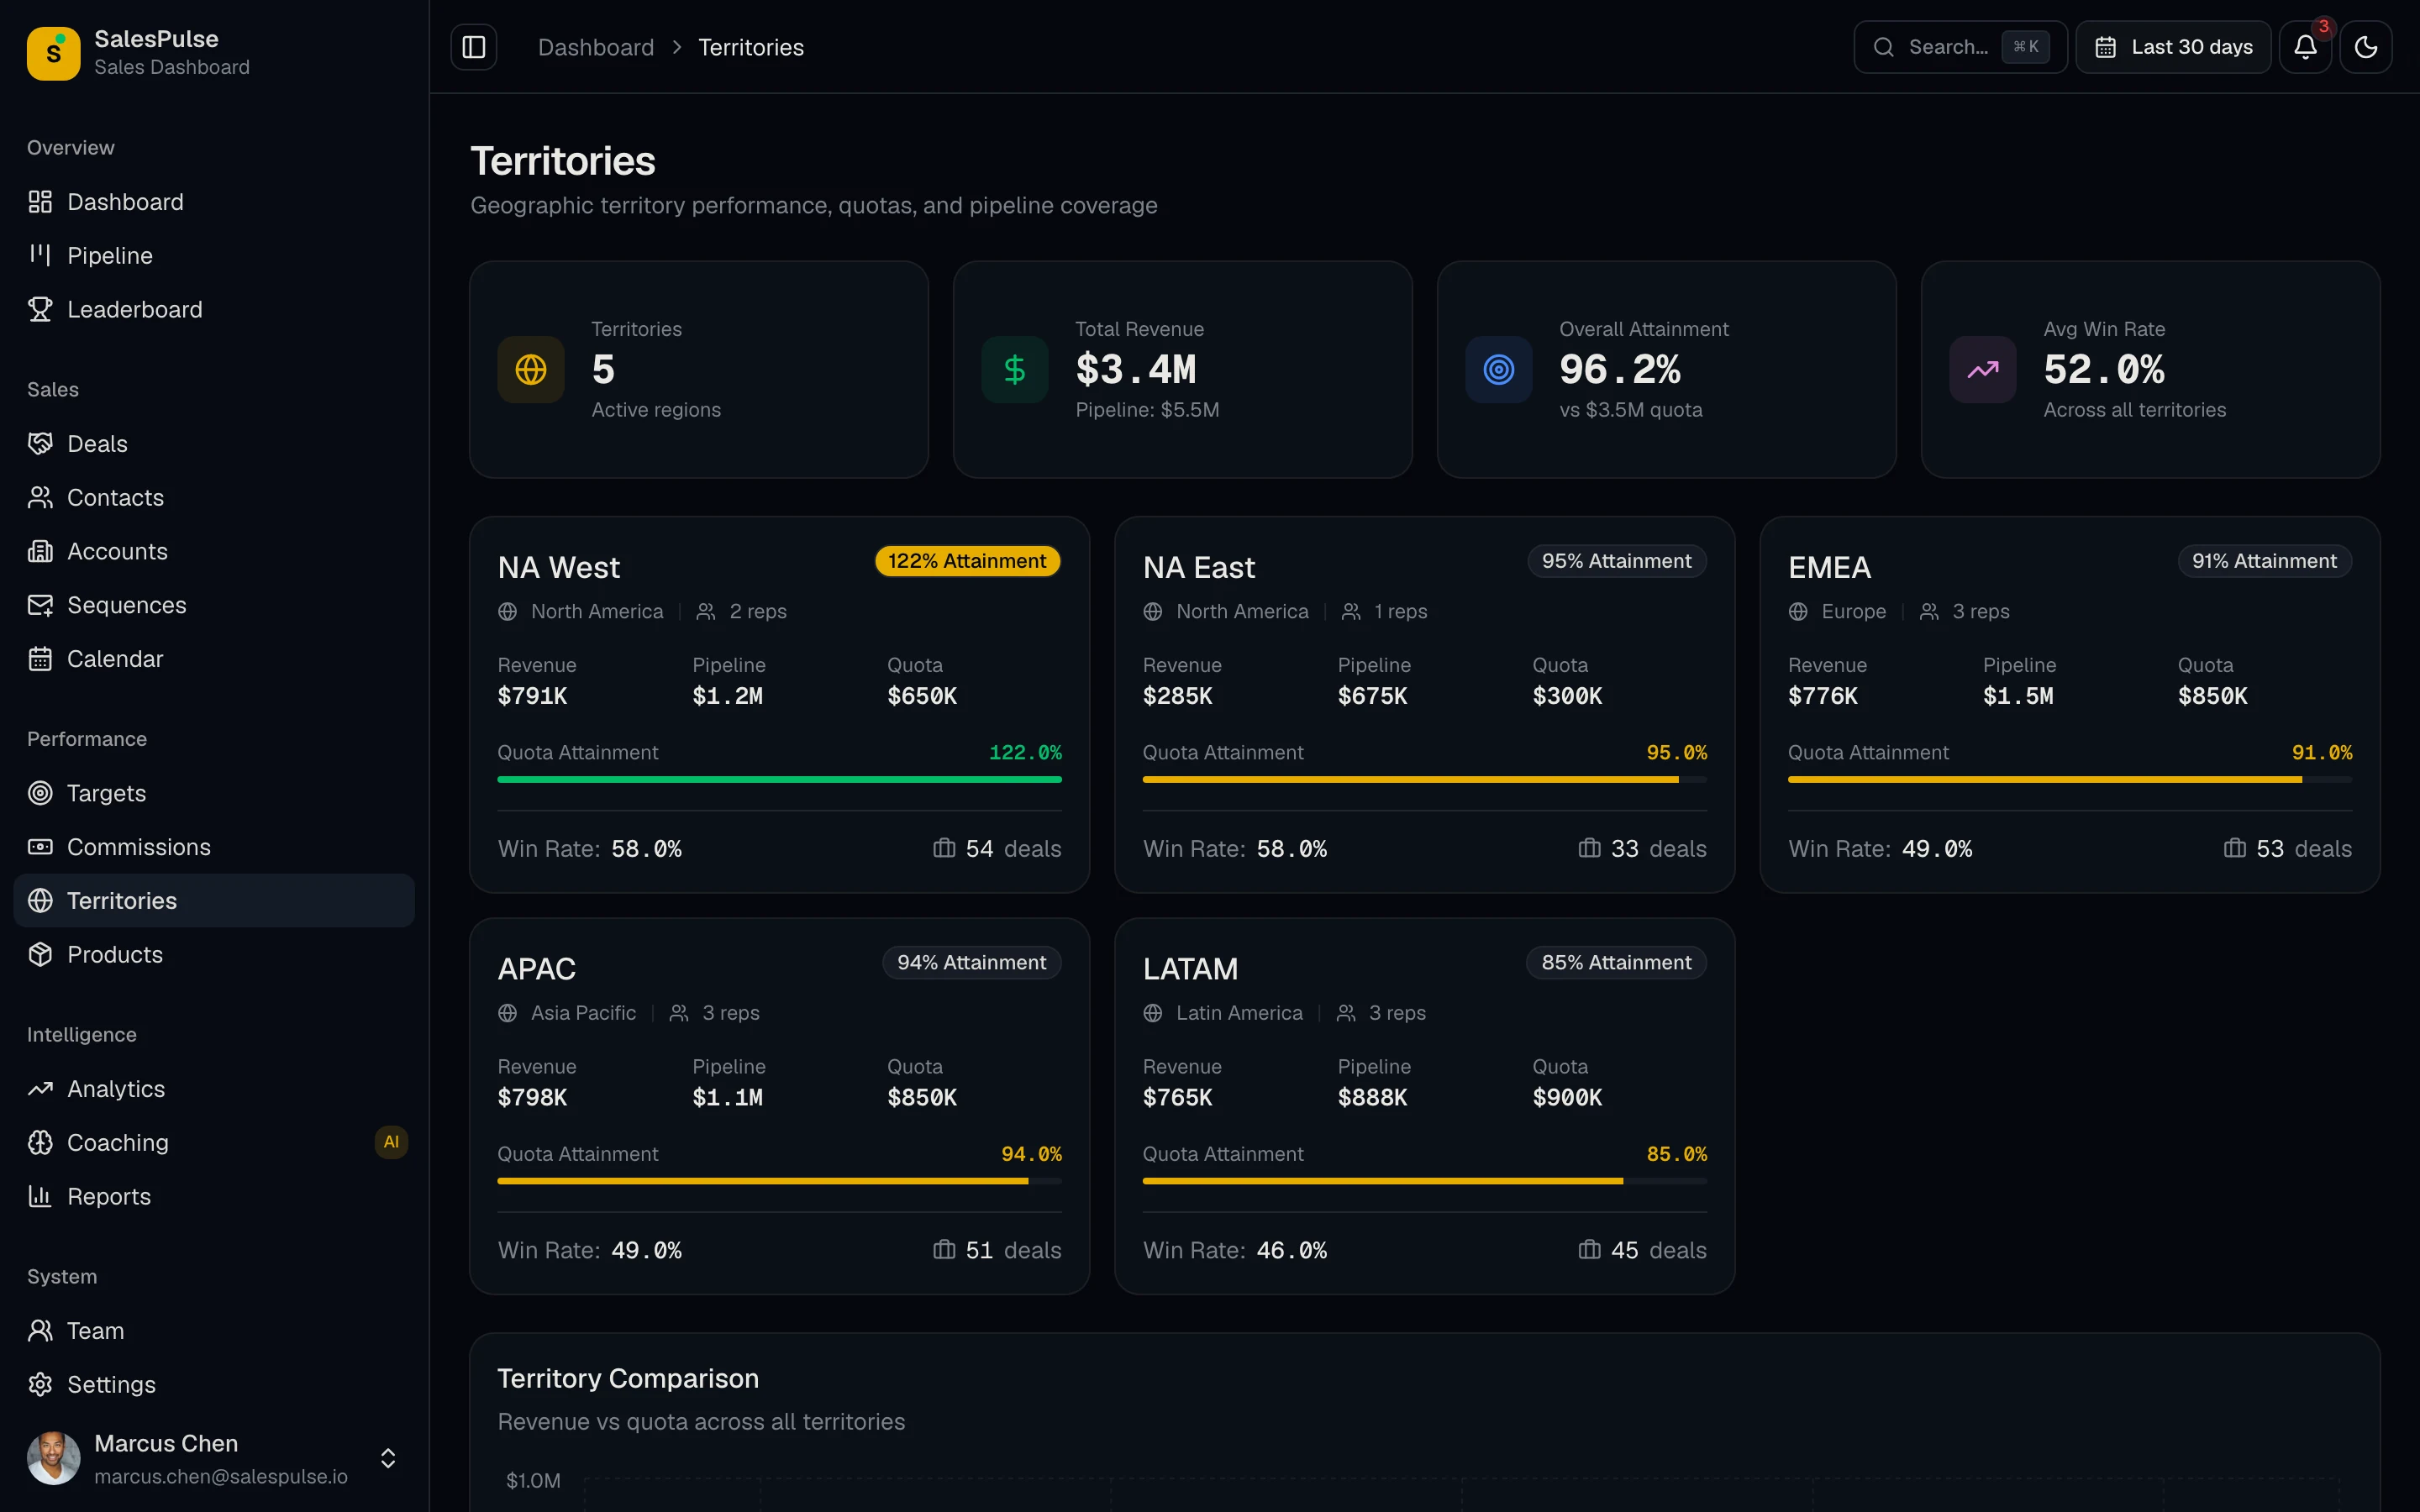

Sales pipeline board with deal cards, stage totals, and weighted pipeline value
How SalesPulse — Sales Performance Dashboard Compares
See how thefrontkit stacks up against typical alternatives on the features that matter most.
| Feature | thefrontkit | Typical Alternatives |
|---|---|---|
| Sales Pipeline | Visual pipeline with drag-drop stages, deal cards, and weighted forecasting | Basic list view or static funnel chart |
| Deal Management | Deal details with values, close dates, contacts, activity timeline | Simple deal list with minimal detail |
| Target & Quota Tracking | Individual and team quotas with progress bars, attainment percentages | No quota tracking or spreadsheet-based targets |
| Leaderboard & Gamification | Rep rankings with performance metrics, badges, and trend indicators | Basic rep list or no leaderboard |
| Revenue Reporting | Revenue trends, win rate analysis, forecast charts, conversion funnels | Simple bar chart or no reporting |
| Screen Count | 9 production-ready screens | 3-5 screens with basic layouts |
| WCAG AA Accessibility | Built-in from day one | Usually missing or partial |
| Dark Mode | Token-driven, system-aware | Basic toggle or missing |
Pricing Information
Solo License (1 developer)
Next.js/Tailwind code. 20 screens. Internal projects only.
Team License (Up to 10 developers)
Next.js/Tailwind code. 20 screens. Internal projects only.
Agency License (Unlimited developers, client delivery allowed)
Next.js/Tailwind code. 20 screens. Client delivery allowed.
Pricing Plans

Next.js/Tailwind code. 20 screens. Internal projects only.
- 1 developer license
- Next.js 16 + Tailwind CSS v4 code
- 20 screens: Dashboard, Pipeline, Deals, Contacts, Accounts, Sequences, Targets, Territories, Commissions, Leaderboard, Reports, Settings
- Visual pipeline board and conversion funnels
- 6 months of updates
- Internal projects only
Next.js/Tailwind code. 20 screens. Internal projects only.
- All current + future apps for 1 year
- Next.js 16 + Tailwind CSS v4 code
- 20 screens: Dashboard, Pipeline, Deals, Contacts, Accounts, Sequences, Targets, Territories, Commissions, Leaderboard, Reports, Settings
- Visual pipeline board and conversion funnels
- 1 year of updates
- Internal projects only
Next.js/Tailwind code. 20 screens. Client delivery allowed.
- Unlimited developer licenses
- All apps + unlimited client projects
- 20 screens: Dashboard, Pipeline, Deals, Contacts, Accounts, Sequences, Targets, Territories, Commissions, Leaderboard, Reports, Settings
- Visual pipeline board and conversion funnels
- Priority support
- Client delivery allowed
7-day refund window after your first sales review. License upgrades credit 100% of what you already spent.
Done-For-You
Skip the setup. We'll launch this app for you.
The team that built SalesPulse — Sales Performance Dashboard deploys it for your business: your branding, your integrations, live in 2-4 weeks. Fixed quote, from $1999.
See all services →- ✓Kit license included
- ✓Your branding via the design token system
- ✓Wired to your backend, CRM, or payment provider
- ✓Deployed to your own account. You own everything
- ✓2 weeks of post-launch fixes
The complete sales dashboard UI — pipeline, deals, targets, and leaderboard in one kit
Sales pipeline with drag-drop stages, deal management with close dates and values, quota tracking with attainment gauges, rep leaderboard with rankings, and revenue reports with forecast charts. Ship a Salesforce-quality sales dashboard on your own stack.
Related Articles
View all posts →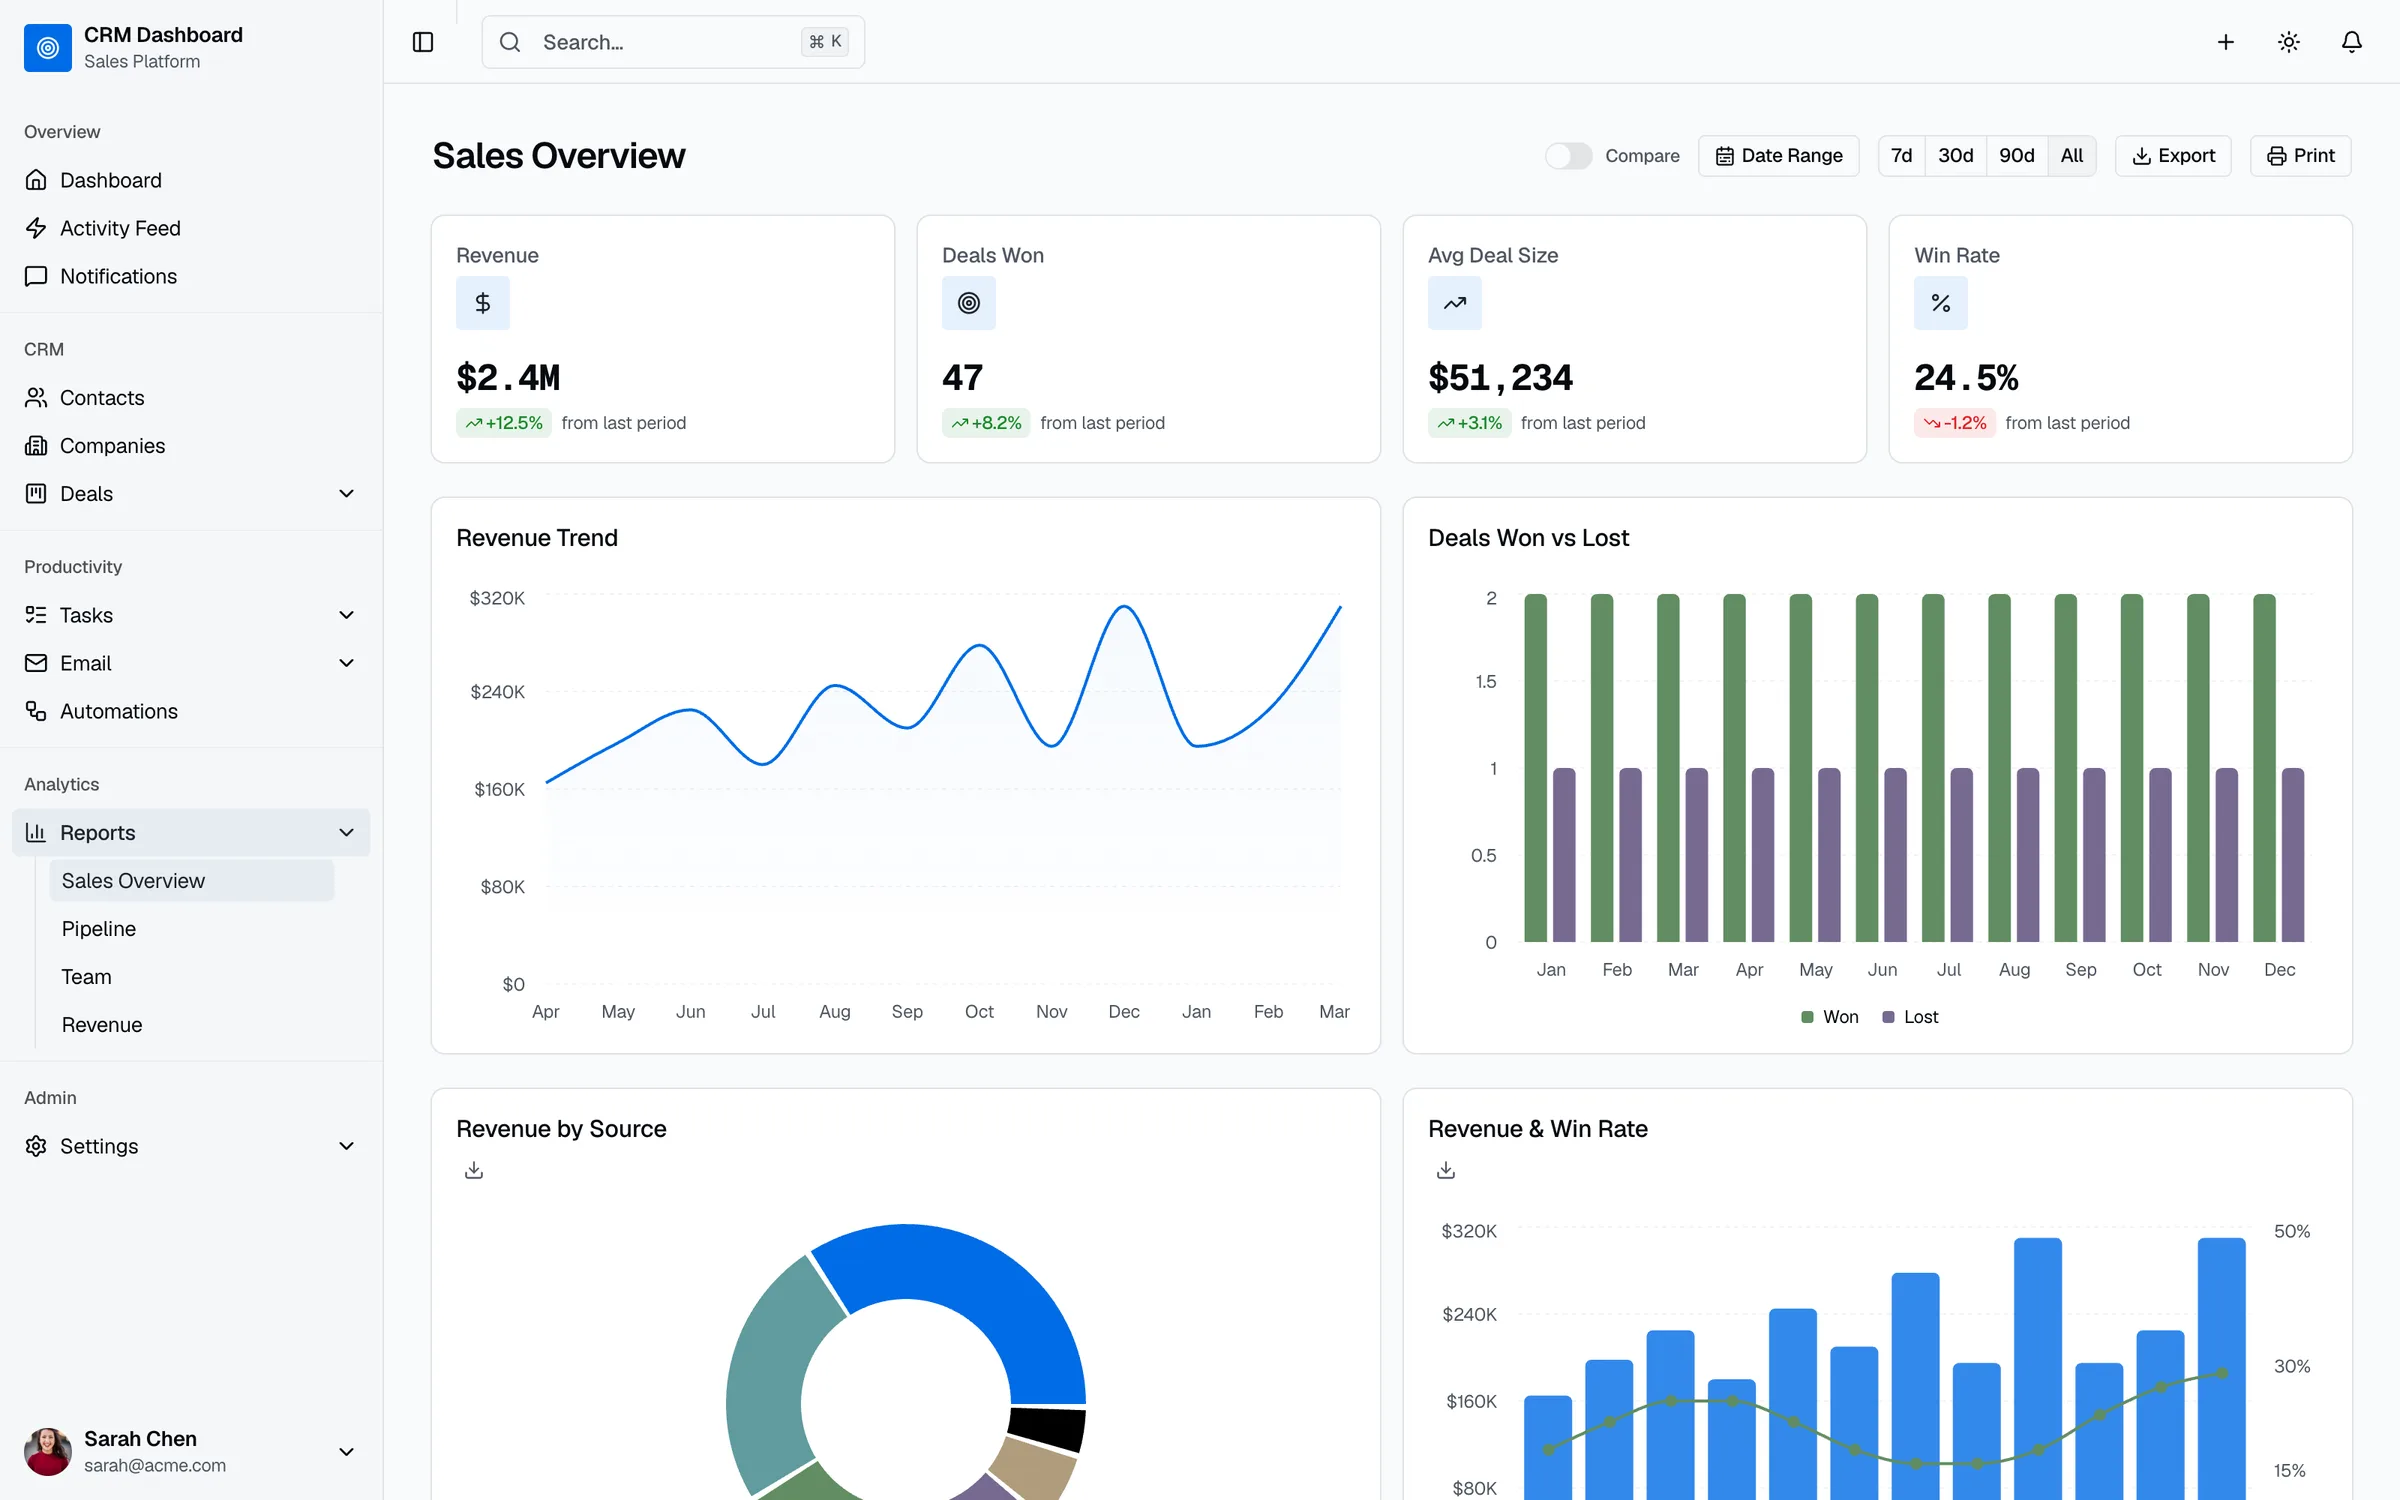
CRM Dashboard Examples: 8 Layouts and the Metrics to Track
8 CRM dashboard examples, from pipeline and forecast to rep performance and data quality, with the metrics, formulas and charts that belong on each one.
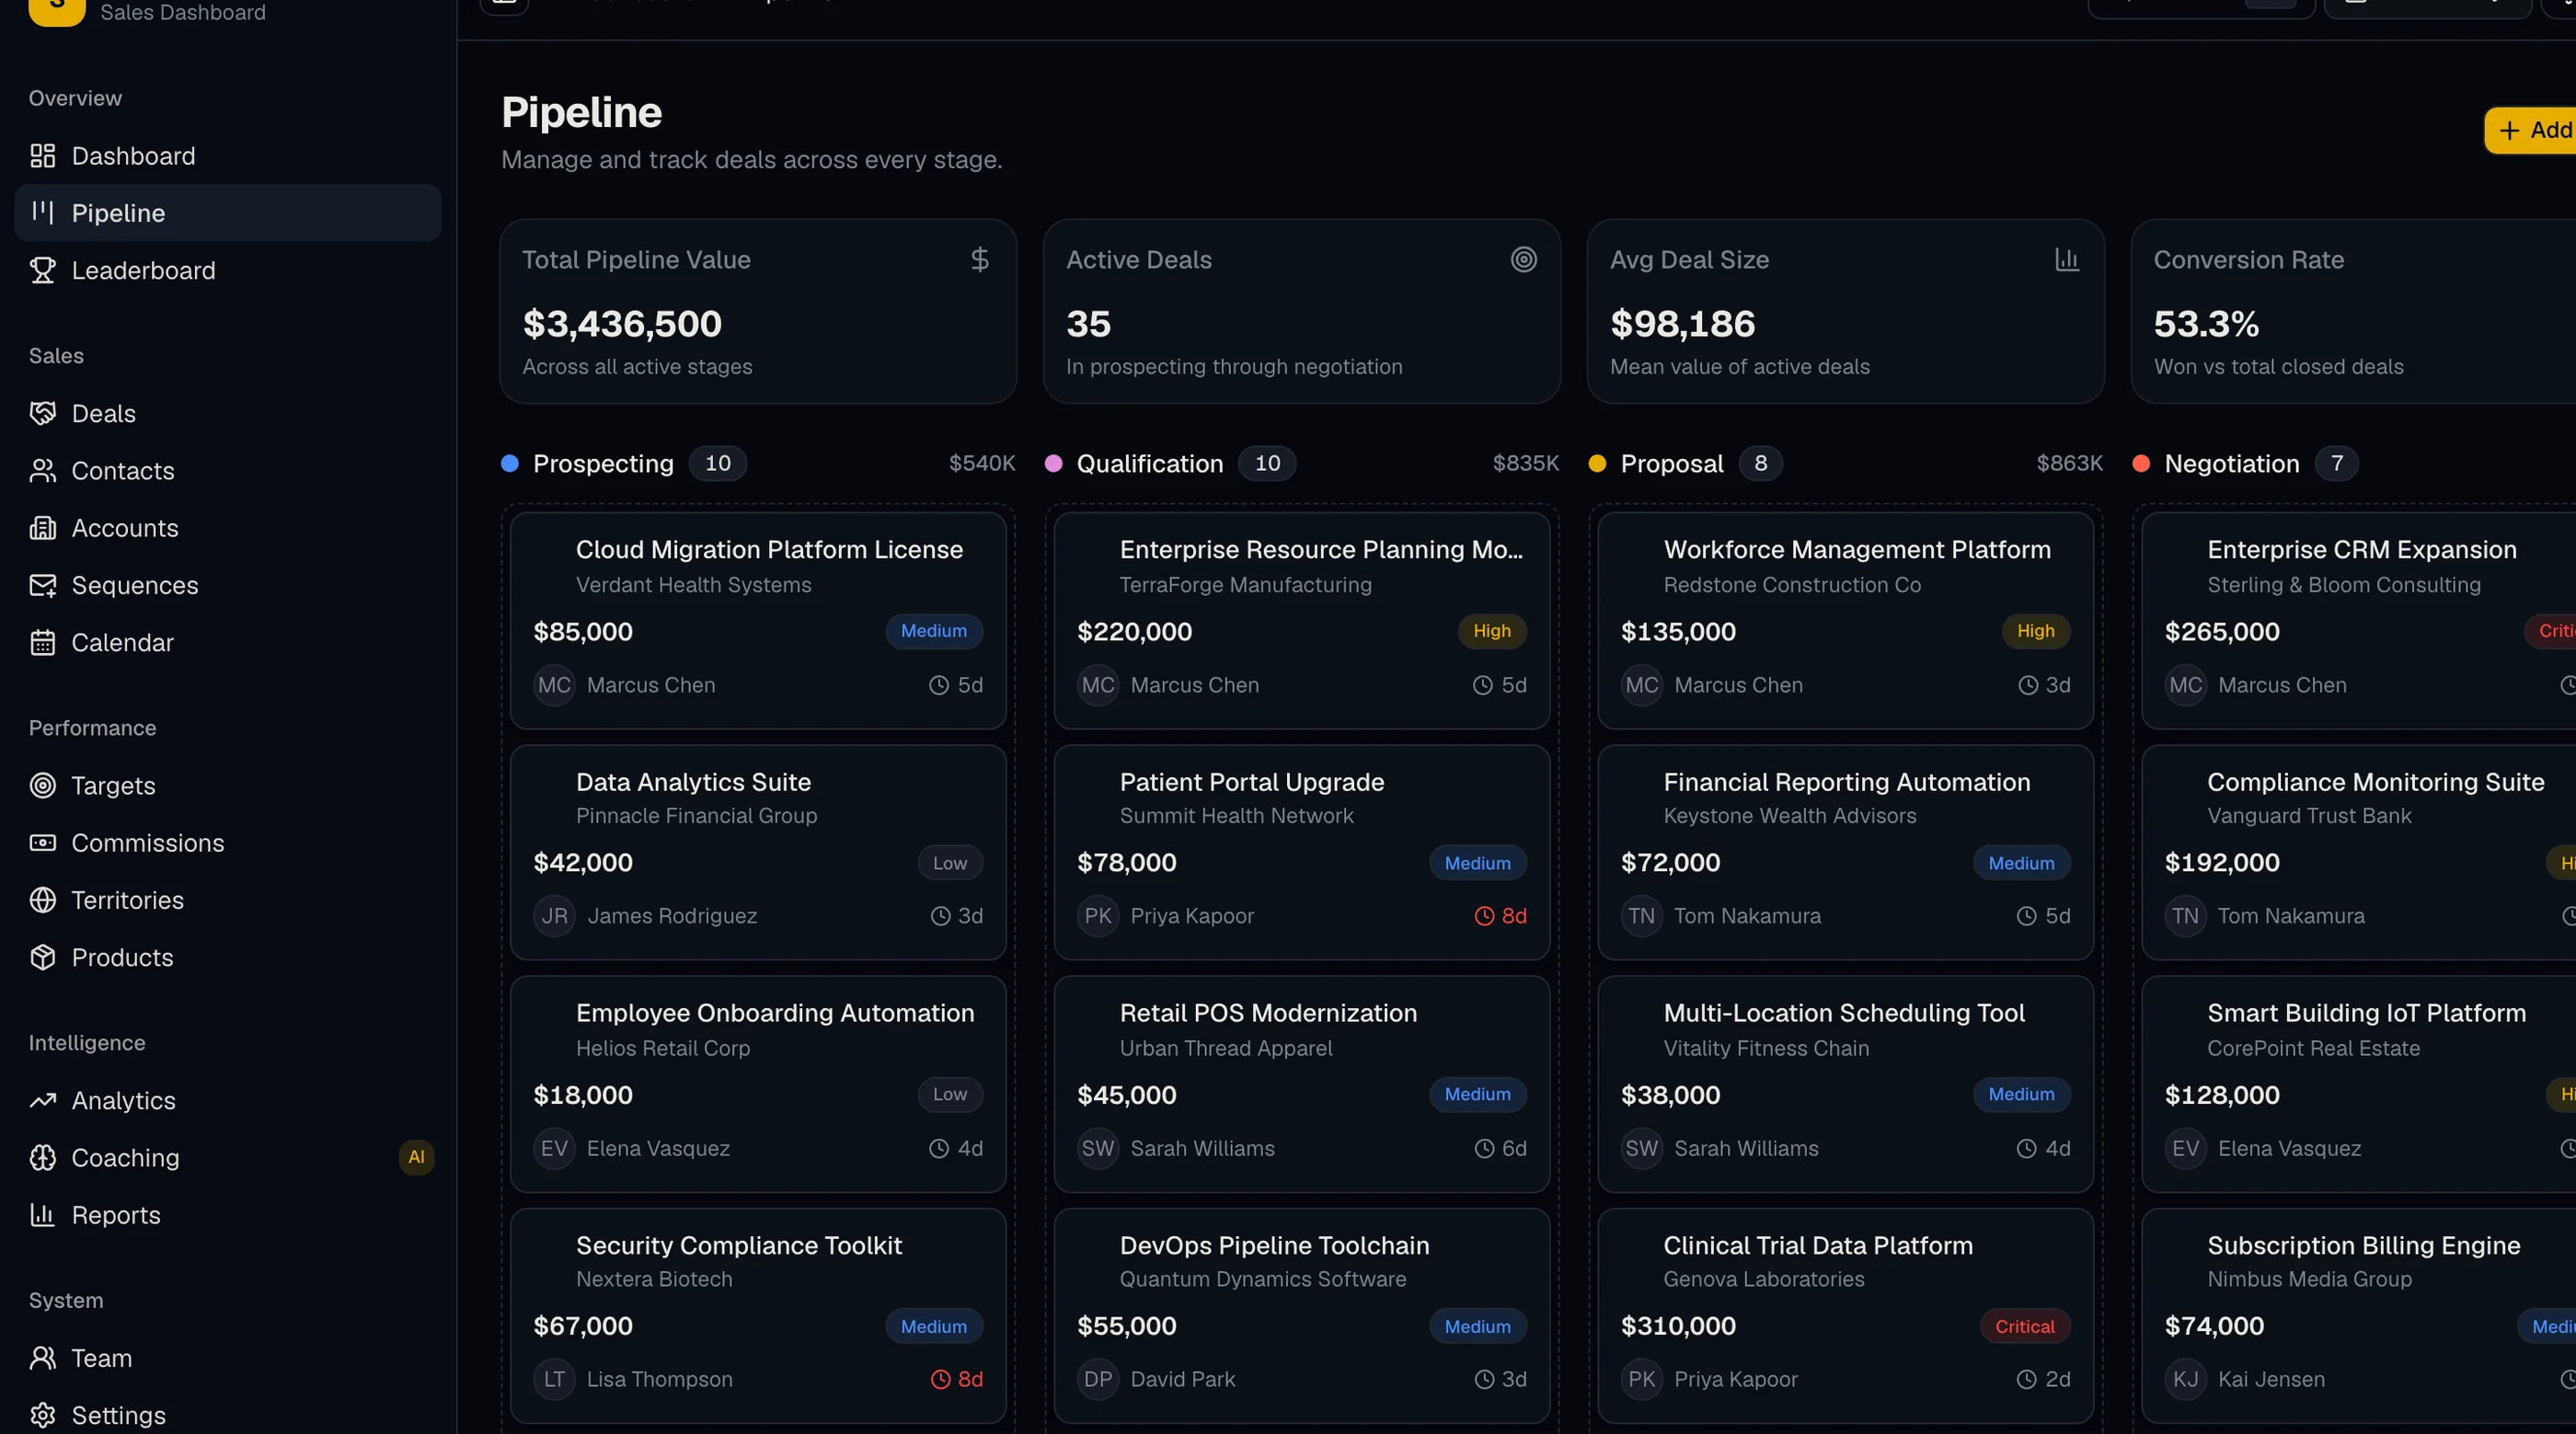
Pipedrive Alternatives: 10 Sales CRMs Compared for 2026
10 Pipedrive alternatives compared on pricing, sales motion, and hosting: Clarify, HubSpot, Zoho, Close, Attio, Twenty, and building your own in Next.js.
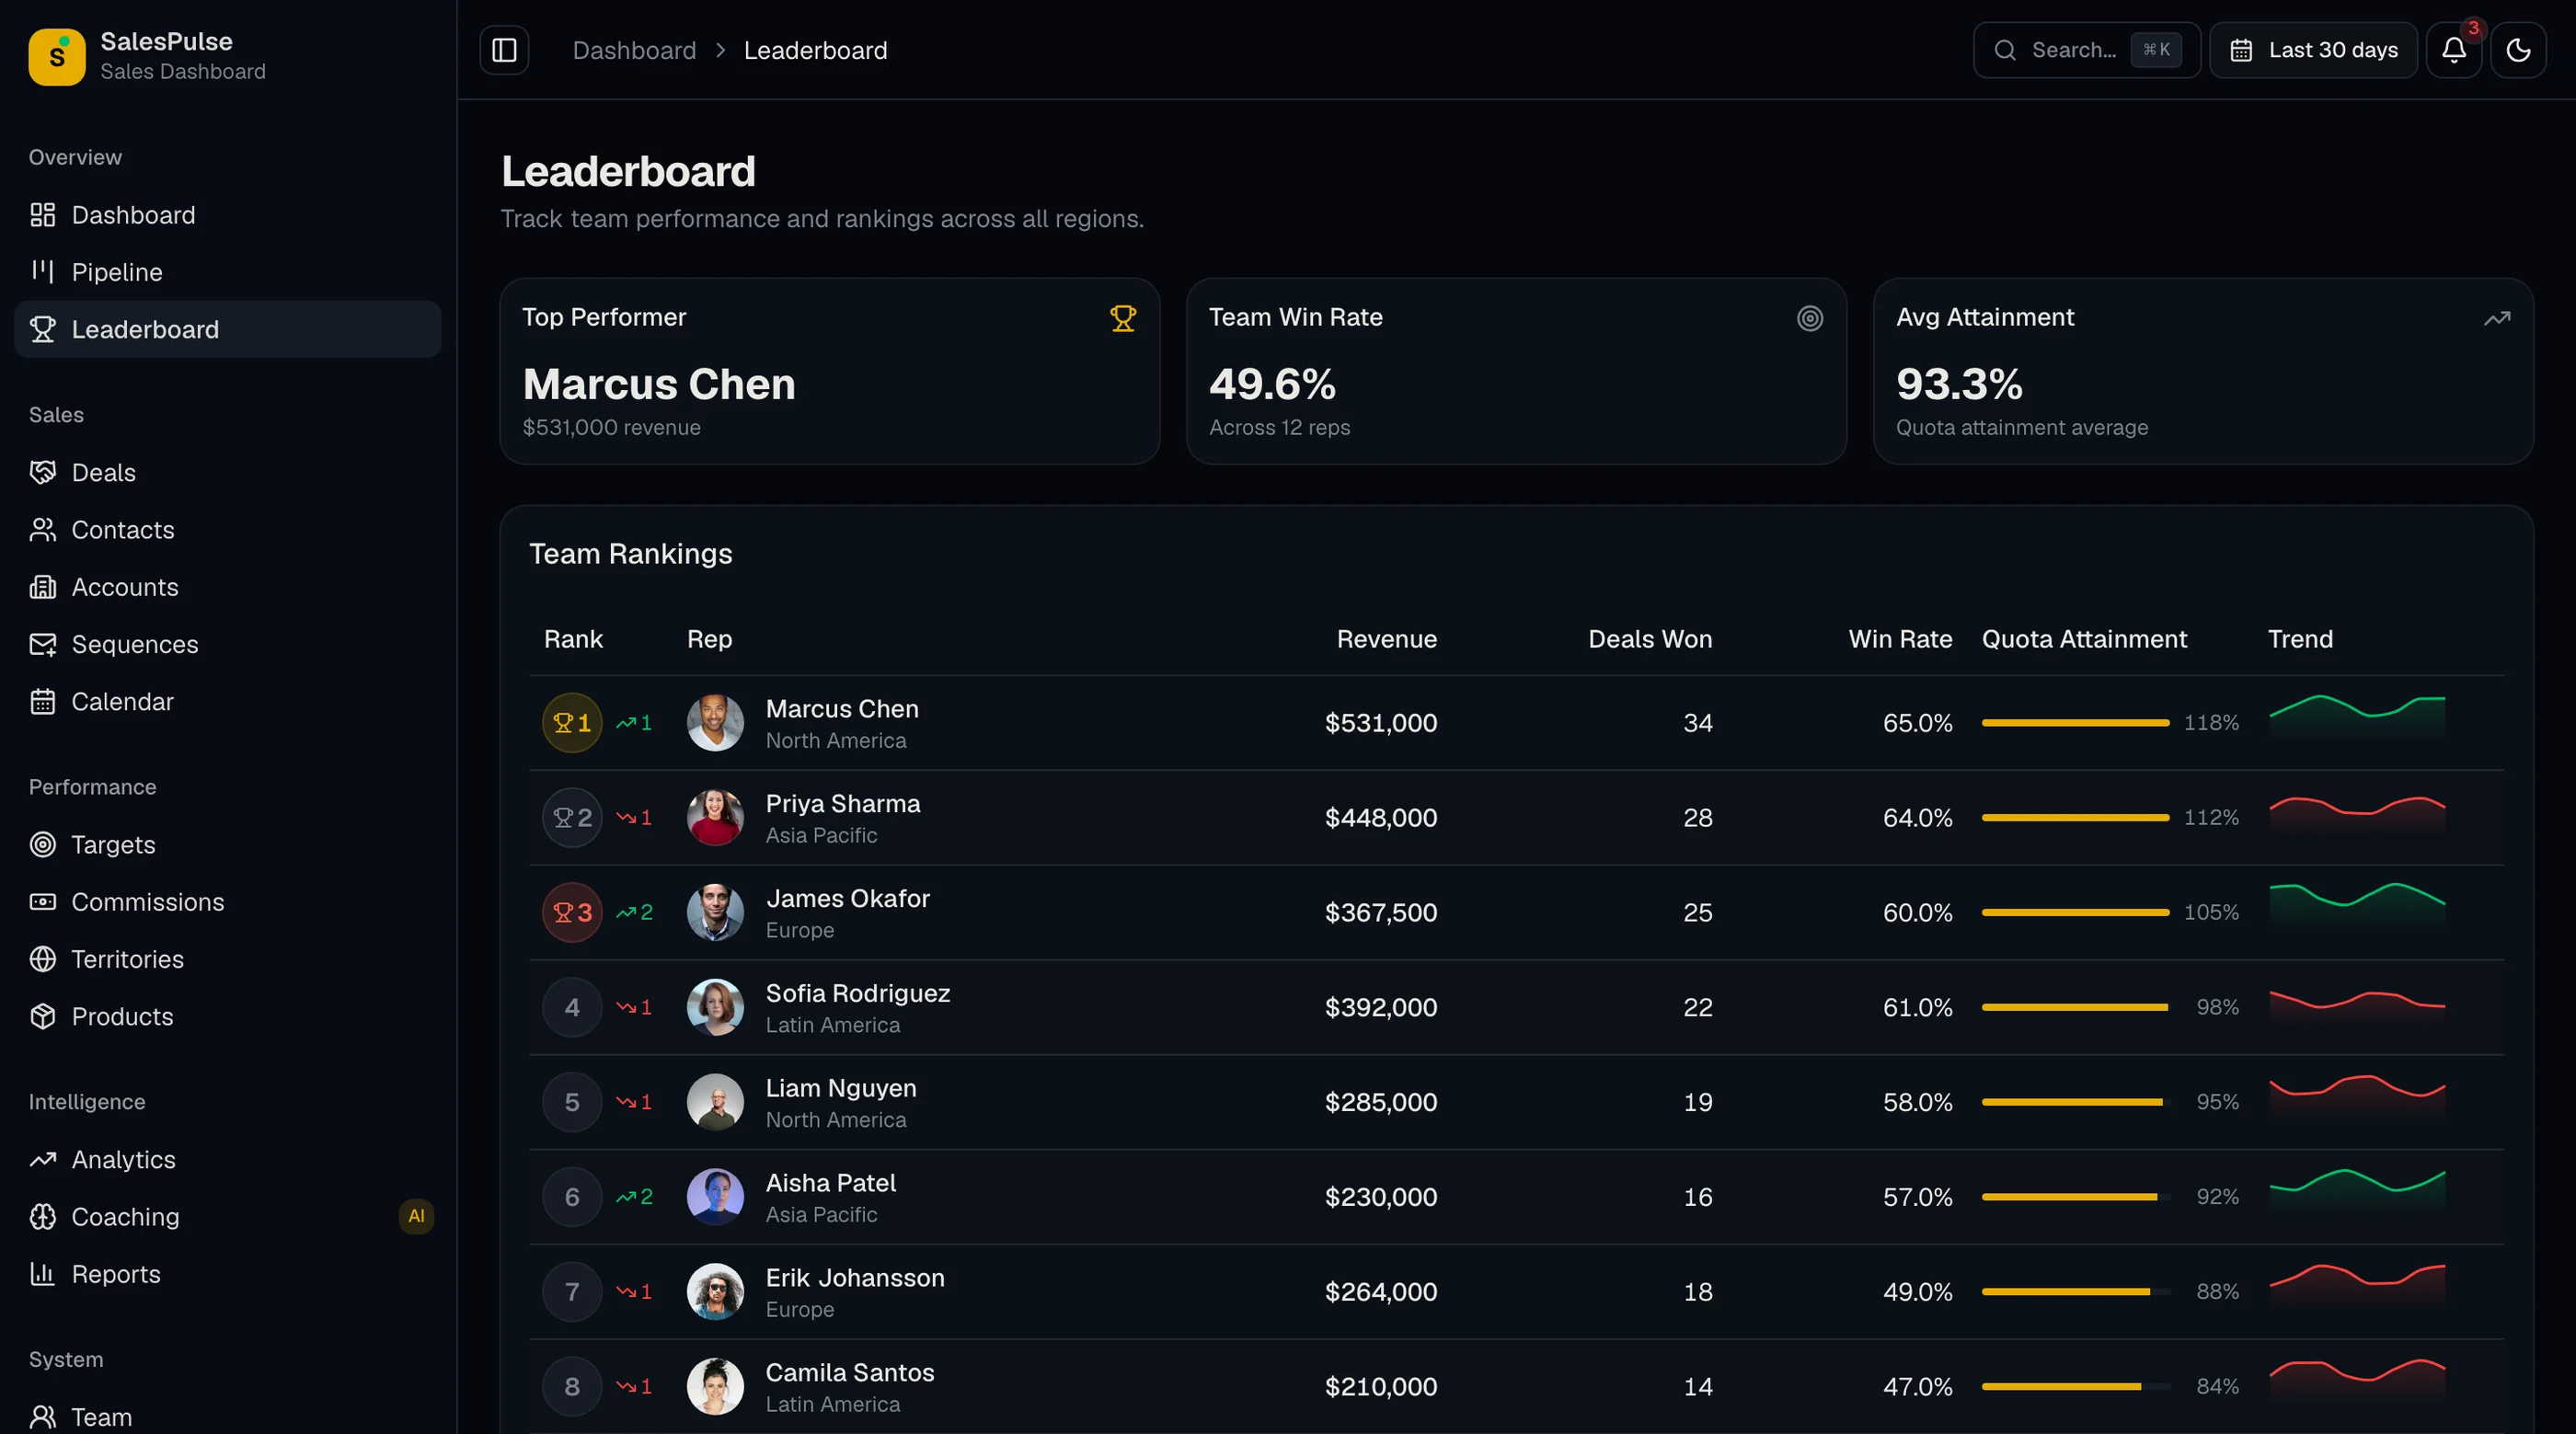
Why Sales Dashboards Stop Getting Opened After 6 Weeks
Most sales dashboards lose reps and managers within six weeks. Five reasons: data lag, vanity metrics, no decision triggers, and broken CRM sync.
How to Build a Sales Dashboard in Next.js (2026)
Practical walkthrough of a Next.js sales dashboard: pipeline tracking, quota progress, forecast accuracy, and a data model that holds up across reps.
How to Choose a Next.js Sales Dashboard Template in 2026
A practical guide to evaluating Next.js sales dashboard templates. What separates a real sales performance tool from a revenue chart.
Sales Dashboard Templates 2026: 10 Options (Excel, BI & Code)
The best sales dashboard templates in 2026, from free Excel and Google Sheets trackers to Power BI, Looker Studio, Geckoboard and Next.js code templates. What each tracks and what it costs.
You Might Also Like
Explore more production-ready business apps.
Explore Related Templates
Find the right starting point for your project.
Next.js SaaS Template
Production-ready SaaS starter with auth, dashboards & Tailwind
Next.js Dashboard Template
Sidebar navigation, data tables & analytics panels
Next.js Landing Page Templates
10 free and paid landing templates compared
React Admin Dashboard
CRM, HR & analytics admin panels
Pricing
Compare plans: Free, Single App, All UI Kits, Agency
Frequently Asked Questions
Find answers to your key questions about thefrontkit. Our FAQ section covers licensing, customization, and technical details, ensuring you have everything you need before getting started.
20 screens total: a main dashboard with revenue metrics and quota attainment; a pipeline board with drag-and-drop deal stages; deals; contacts; accounts list and account detail; sequences; a calendar; coaching; commissions; quota targets; territories; a rep leaderboard; products; analytics; reports; team; settings; and 2 auth pages (login and register).
No. This is a frontend UI kit. All screens use mock seed data with sample deals, pipeline stages, sales reps, targets, and revenue figures. You connect your own backend, CRM API, or database. The UI layer handles display, interaction, and form structure.
Yes. All screens consume typed TypeScript interfaces. Replace the seed data imports with API calls to Salesforce, HubSpot, Pipedrive, or any REST/GraphQL endpoint. The UI is completely backend-agnostic.
Yes. The pipeline board renders deal cards across stage columns with visual drag-and-drop for moving deals between stages. It includes deal value summaries per stage, weighted pipeline totals, and stage probability indicators.
Yes. All screens use semantic HTML, keyboard navigation, proper ARIA labels, focus management, and WCAG AA contrast ratios in both light and dark modes.
Absolutely. The entire color system uses oklch tokens in globals.css. Change the hue value and all 20 screens update instantly. Typography, spacing, and component styles are all token-driven through Tailwind CSS.
Solo and Team licenses are for internal projects. The Agency license allows unlimited developers and client delivery.