Grafana Alternatives: 8 Observability Tools for 2026
Grafana Alternatives: 8 Options Compared for 2026
Grafana is free and open source, so why does anyone search for alternatives? Ask the engineer who maintains the stack. Grafana itself is only the visualization layer: underneath sits Prometheus or Mimir for metrics, Loki for logs, Tempo for traces, and an alerting system with its own opinions. Dashboards accumulate like sediment, JSON configs drift, and the "free" stack quietly costs an engineer-week per month. Grafana Cloud fixes the ops burden and introduces its own: usage-based pricing that's genuinely hard to predict.
Eight alternatives worth comparing, from all-in-one SaaS to lighter open-source options to building the dashboard layer yourself when what you need isn't infrastructure monitoring at all.
We covered the SaaS incumbent's side of this market in our Datadog alternatives guide; this one starts from the Grafana side.
Or skip the build entirely: get NeuralDesk
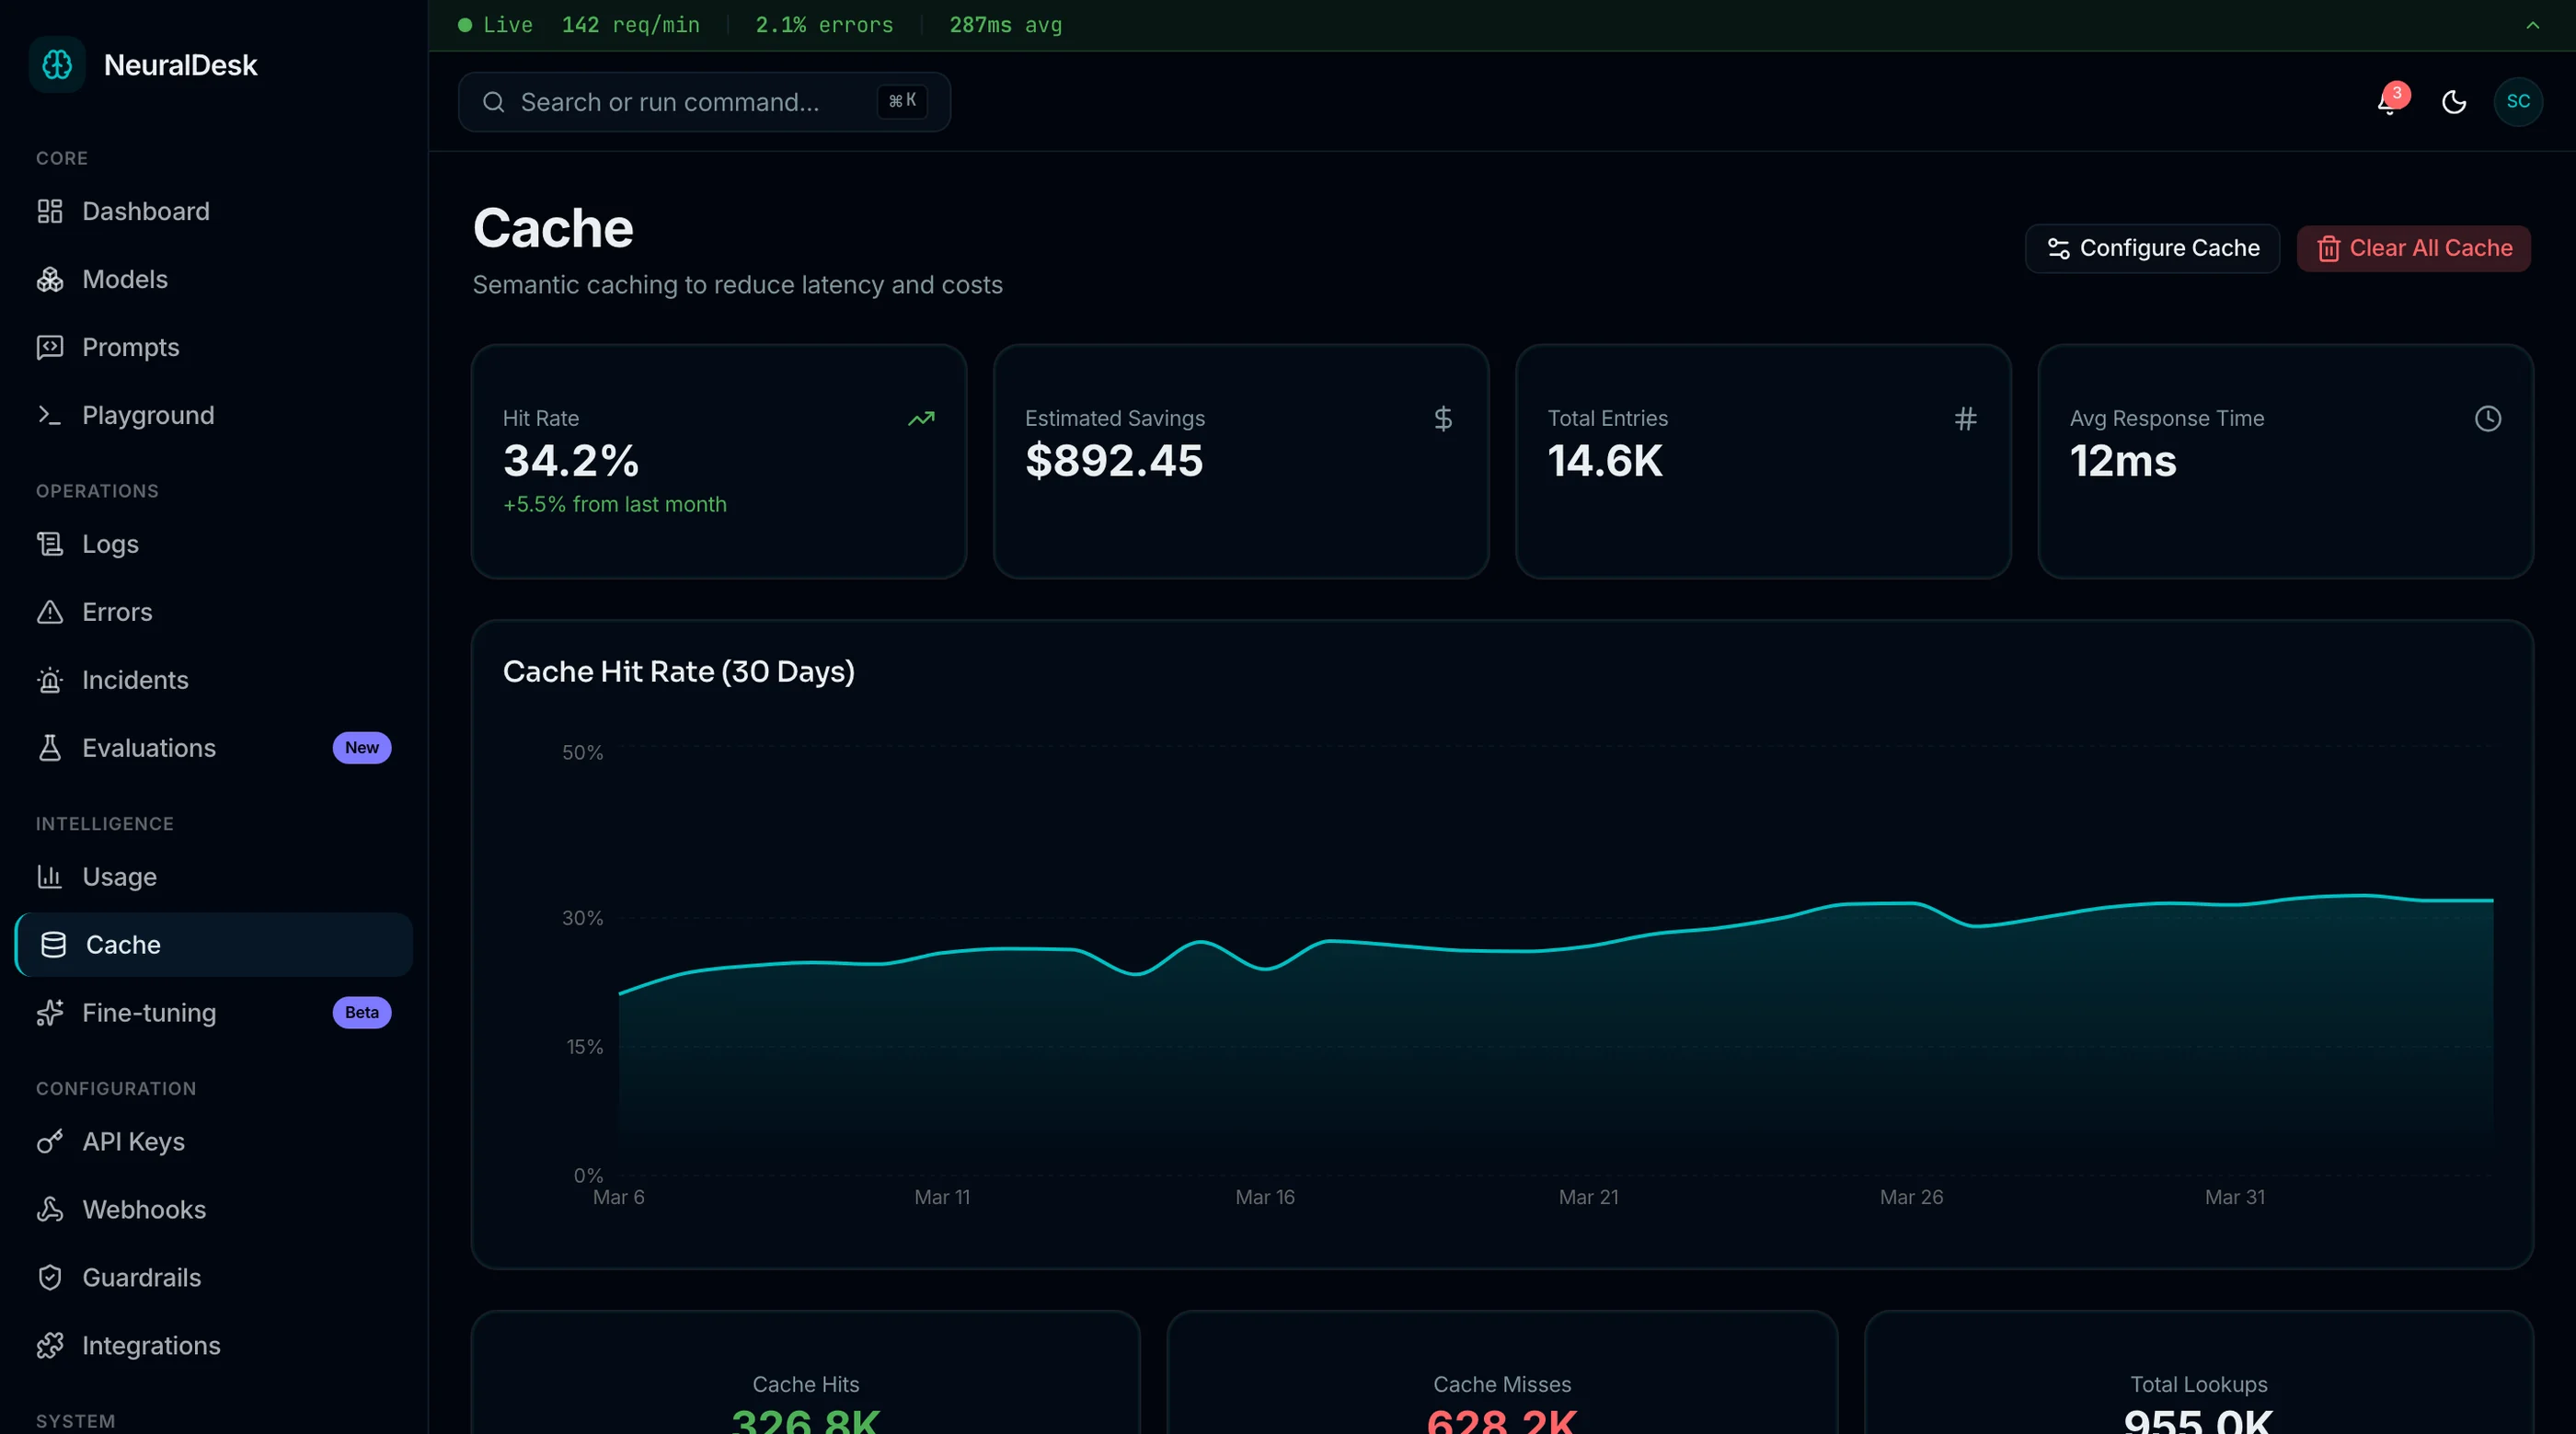
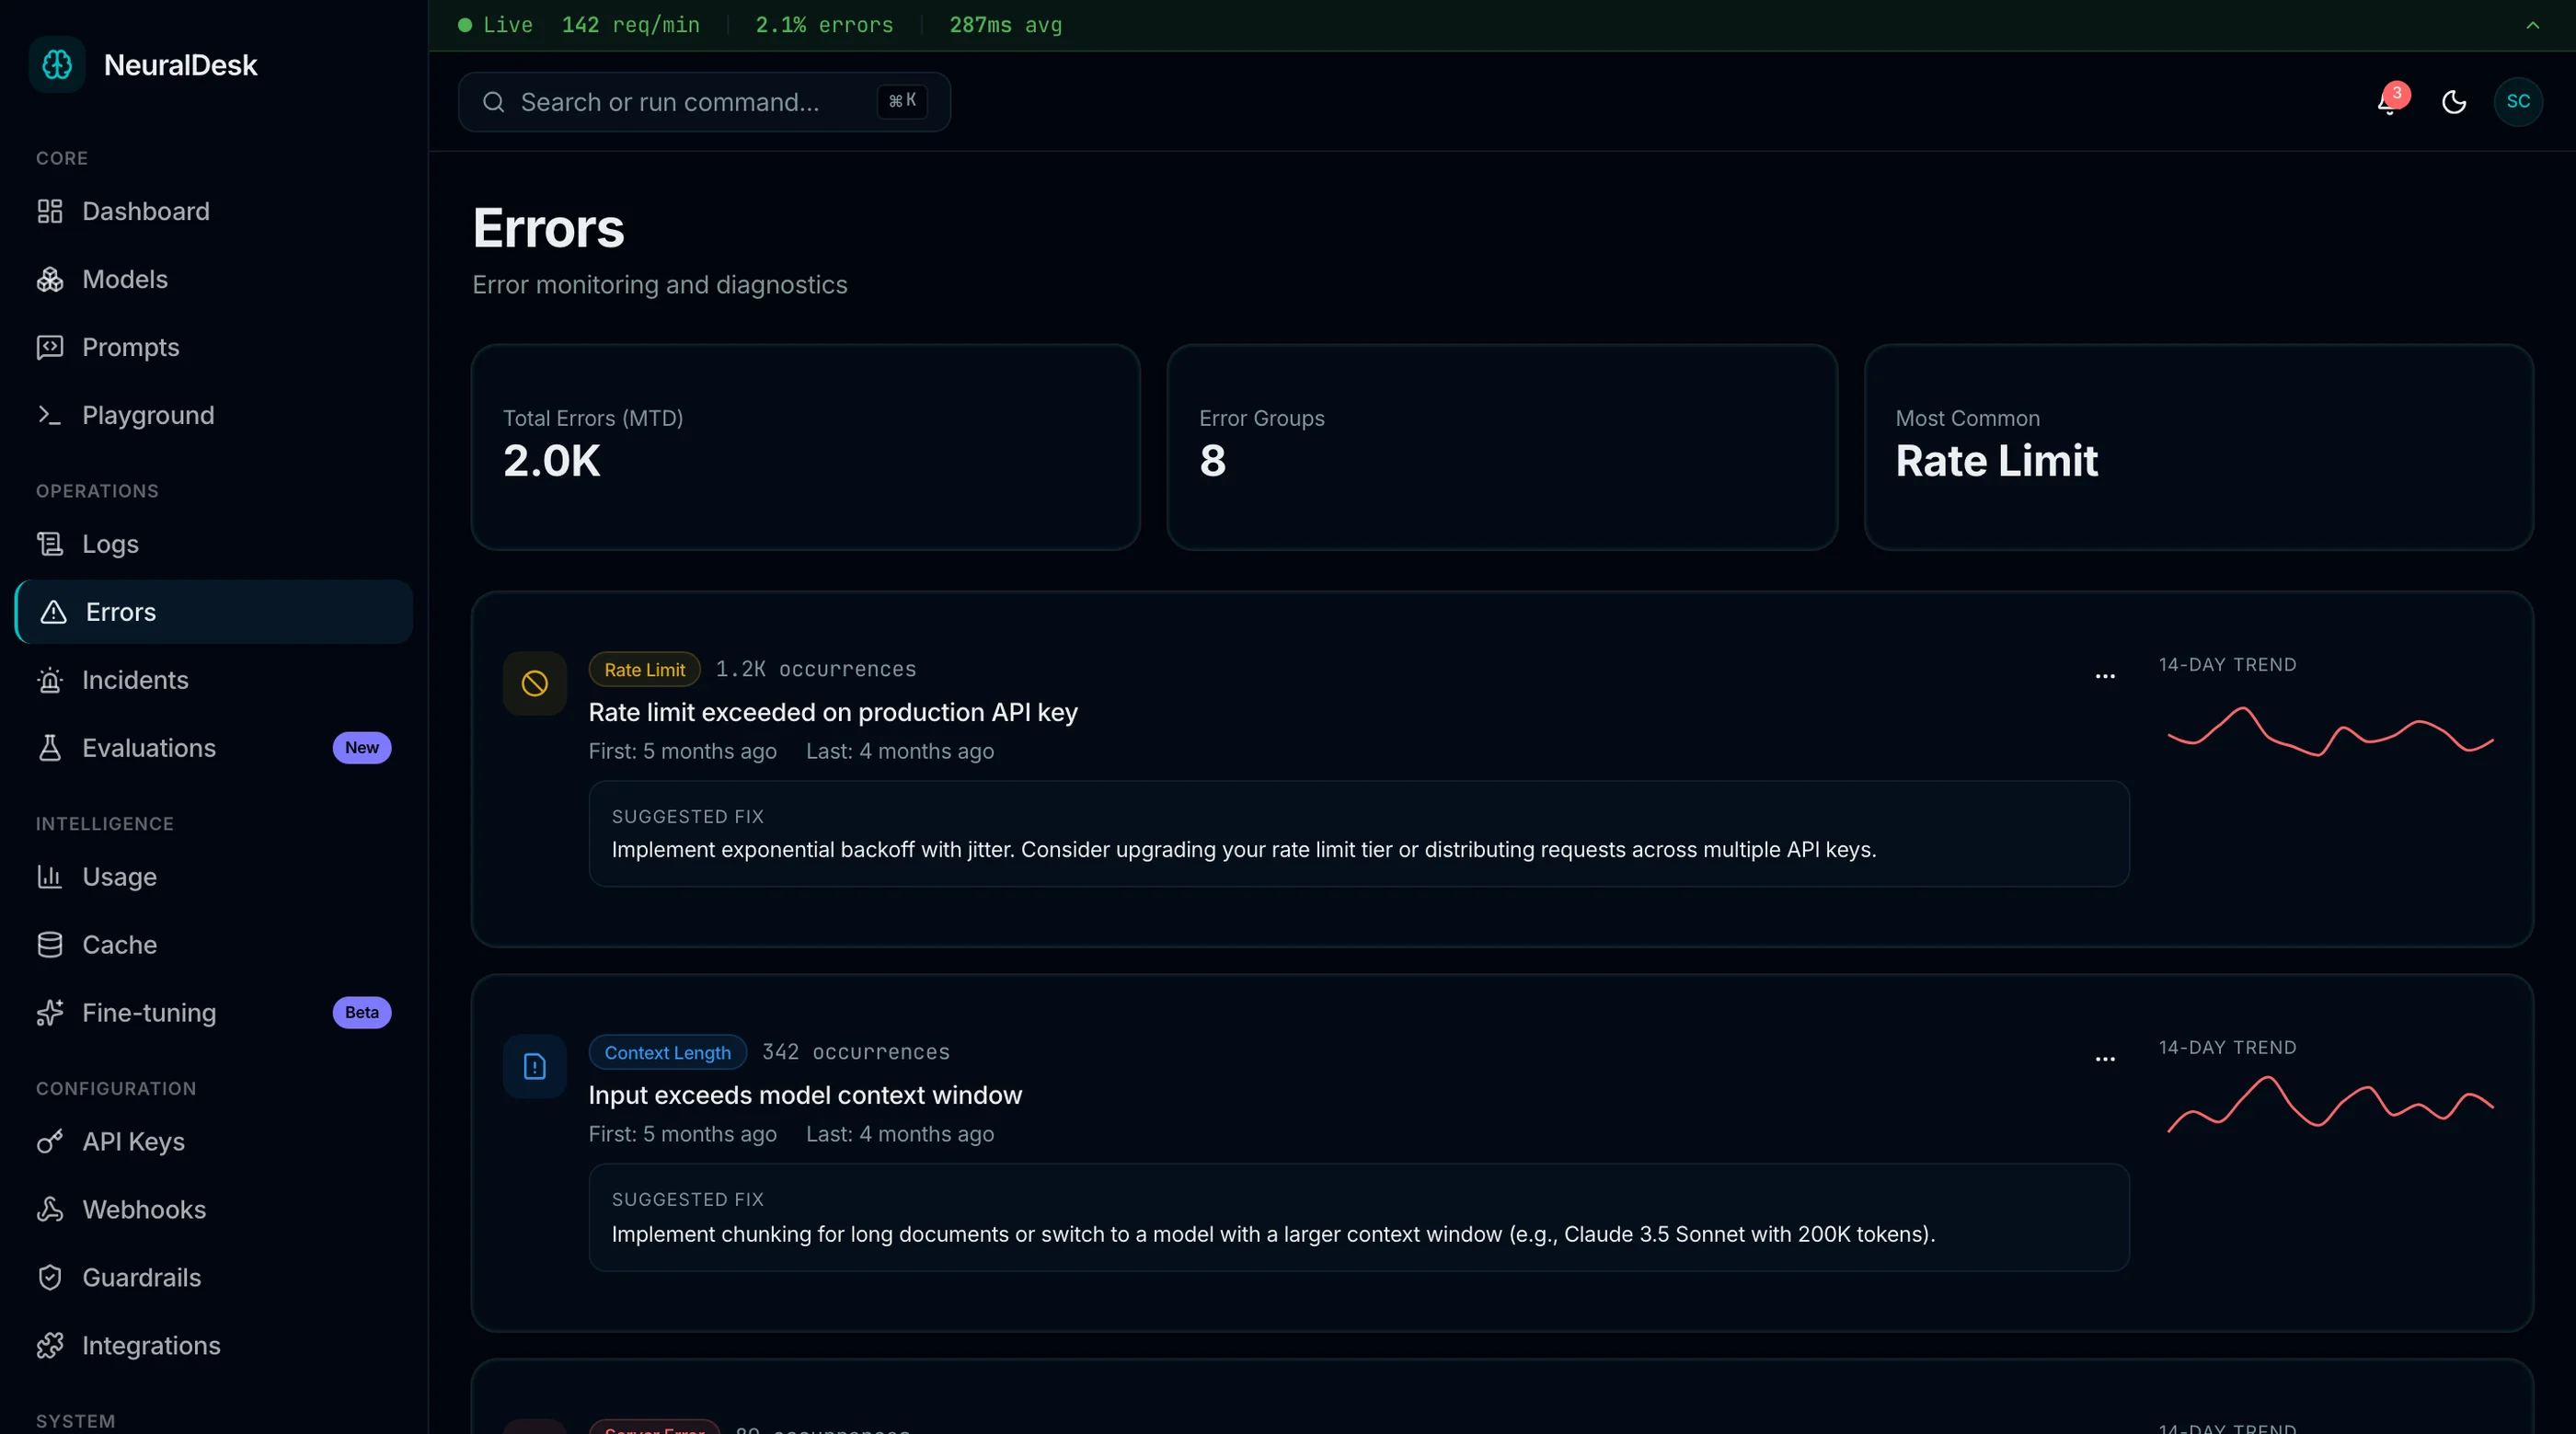
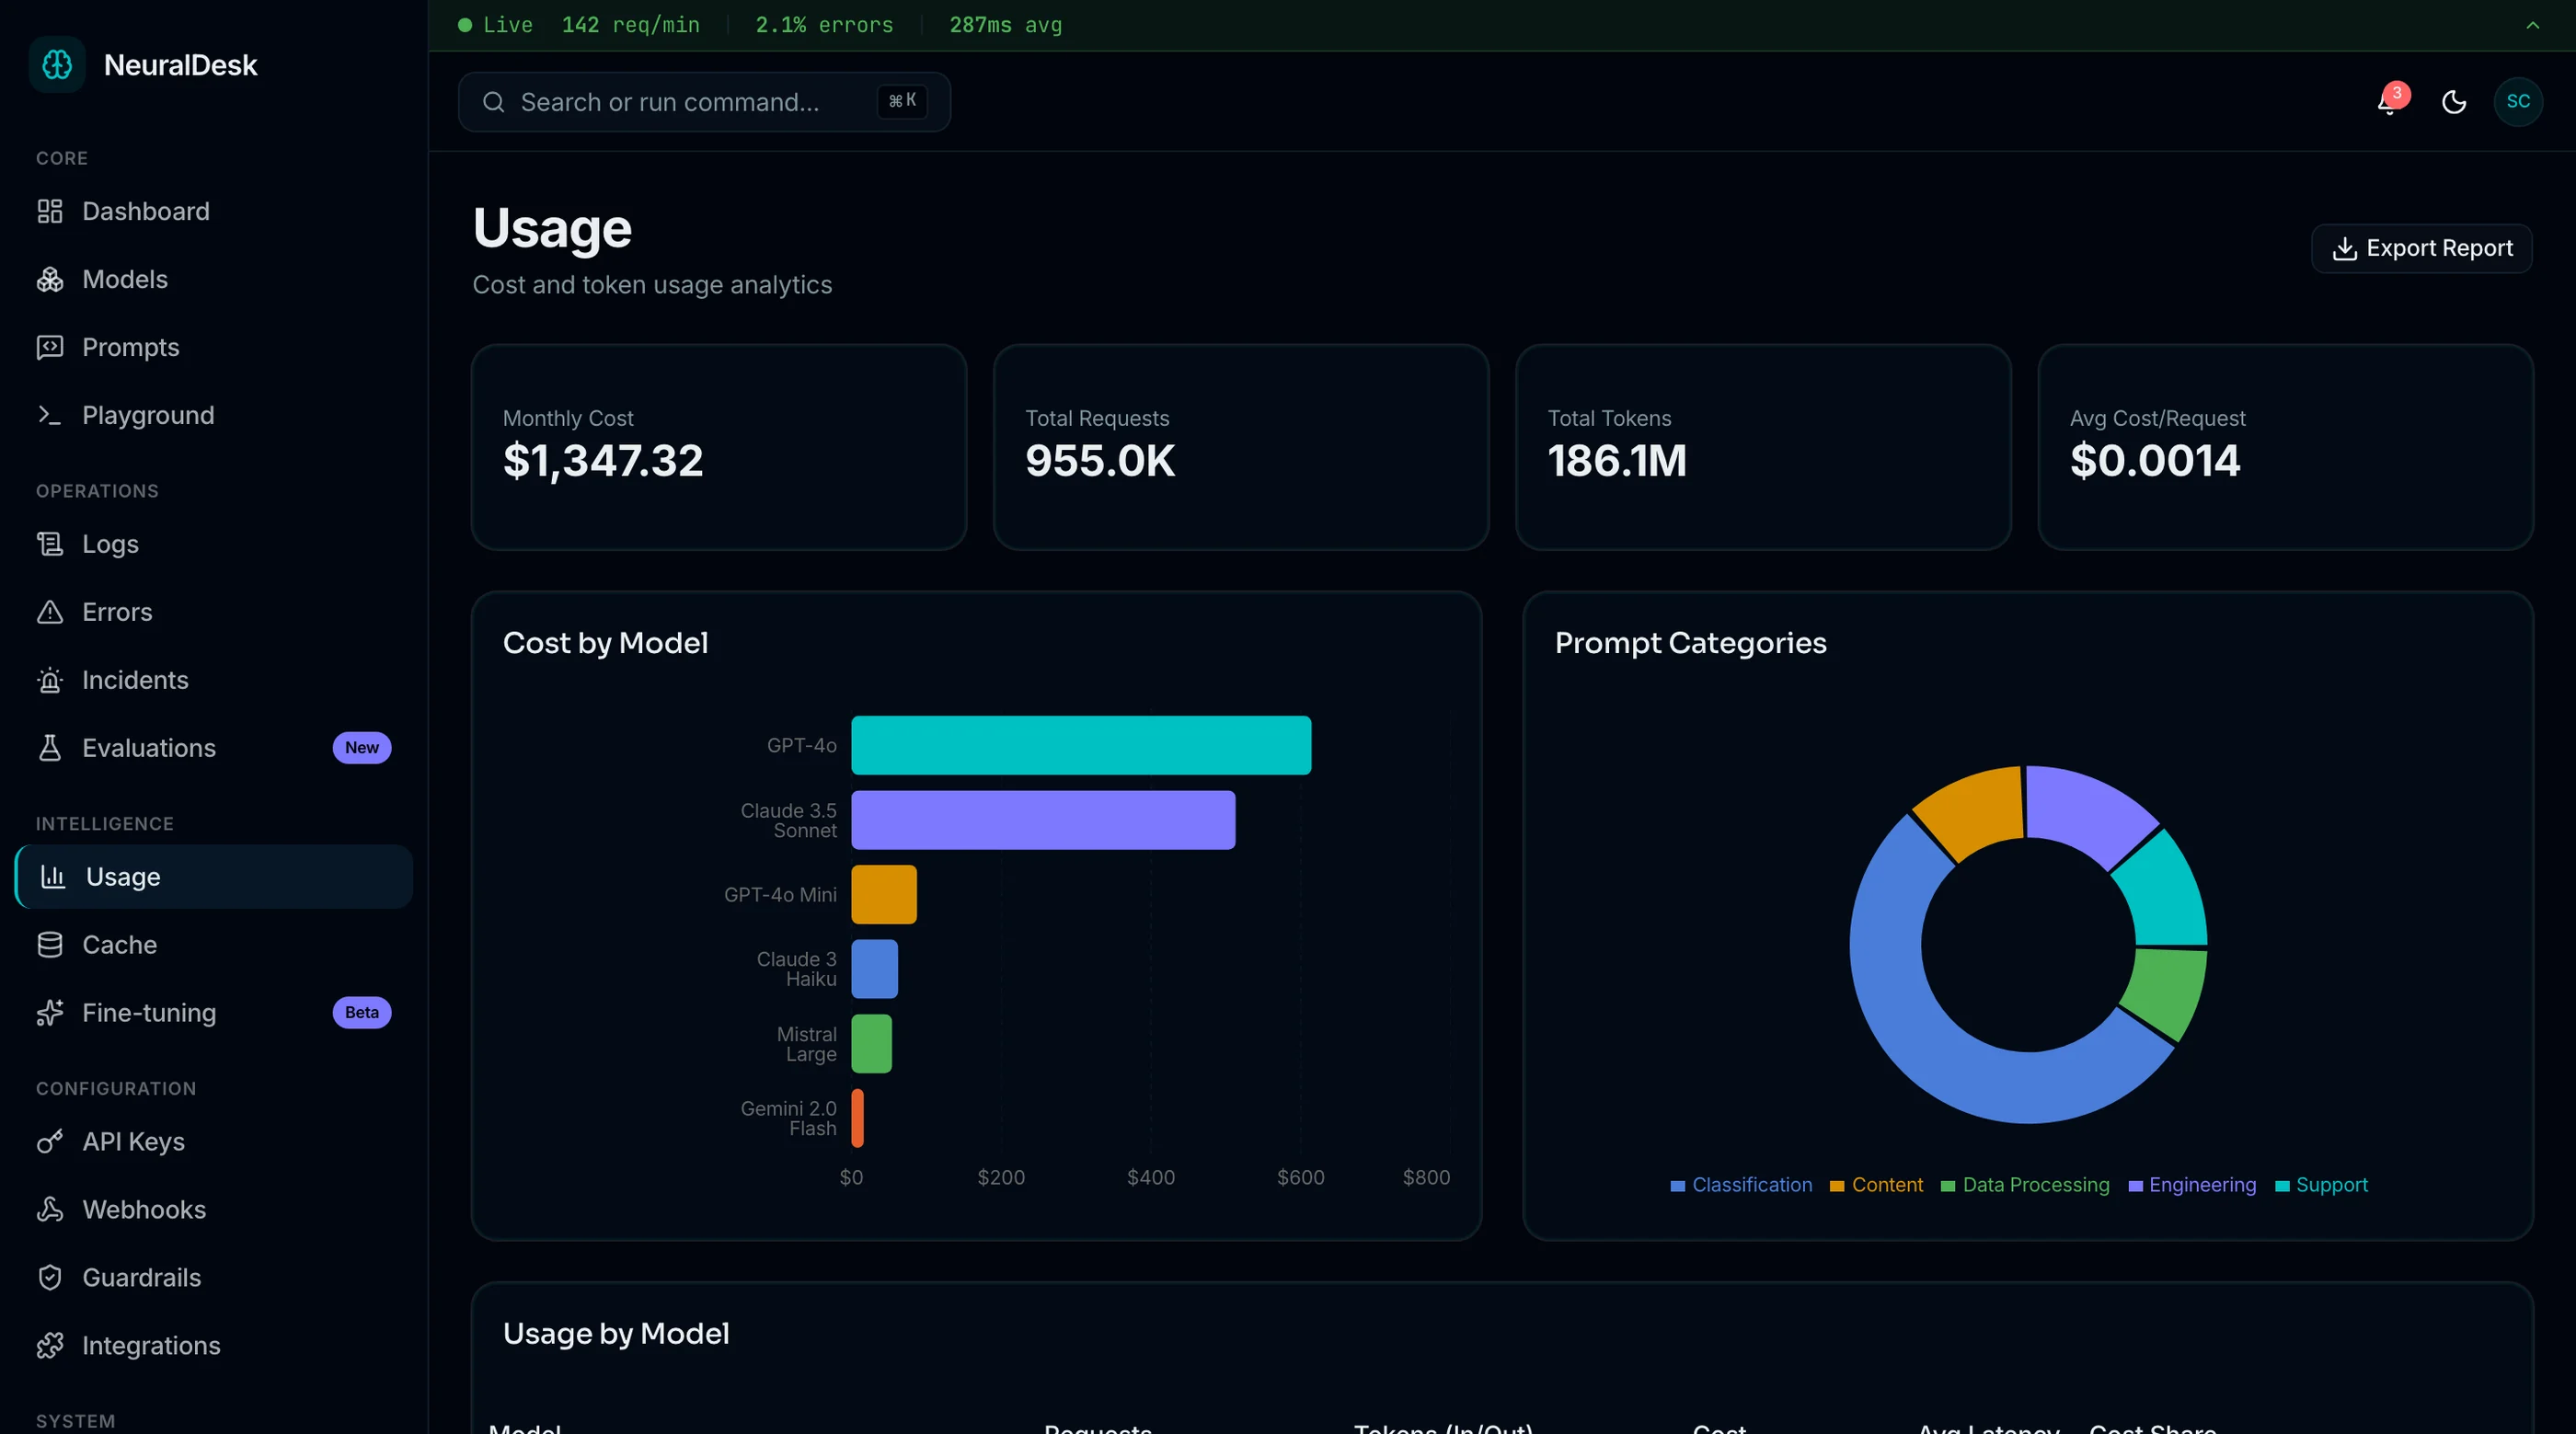
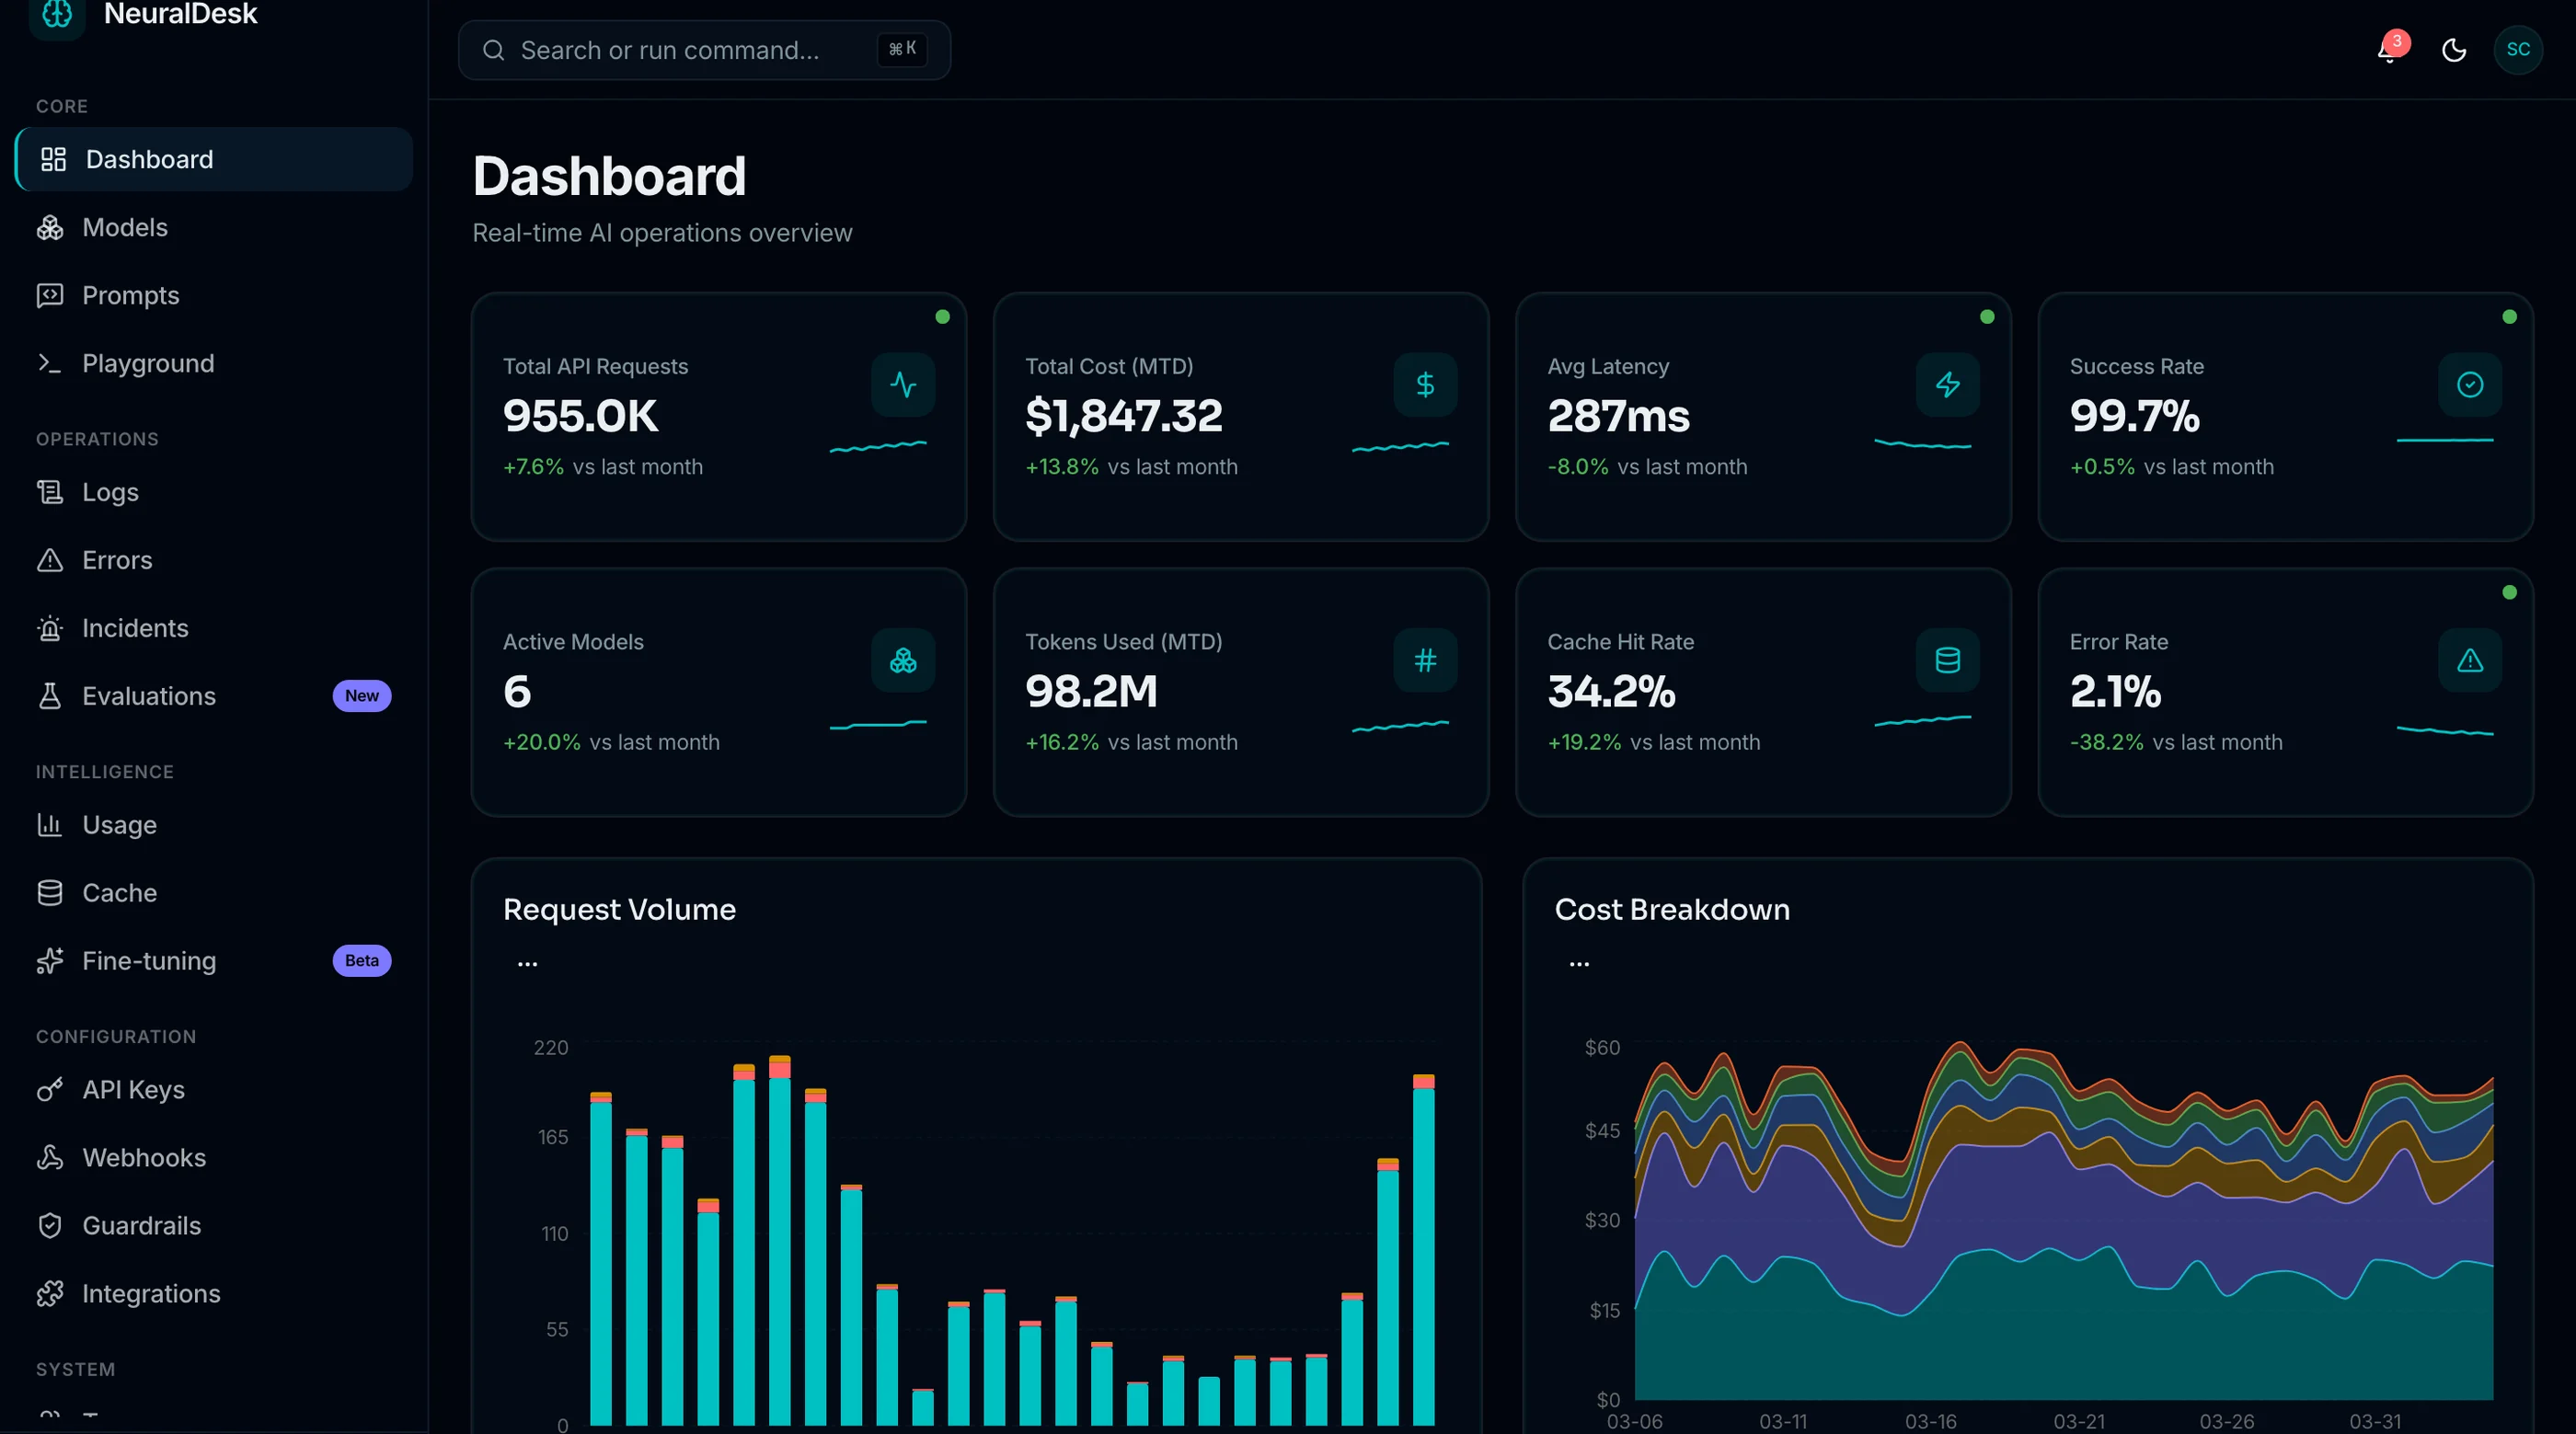
If what you're actually dashboarding is an AI product (models, prompts, token spend, latency), the NeuralDesk AI Ops Dashboard is shipped: model management, prompt engineering views, token usage monitoring, and incident screens. Next.js + Tailwind + shadcn/ui, WCAG AA. $131 solo, $199 team, $349 agency.
Get NeuralDesk → or get every kit (18 total) for $749 via All UI Kits →
TL;DR: Quick Picks for 2026
| Need | Top pick | Price |
|---|---|---|
| Everything managed, best-in-class | Datadog | Usage-based, steep |
| Predictable all-in-one pricing | New Relic | Free tier, usage-based |
| Open-source APM + traces + metrics in one | SigNoz | Free (self-host), cloud tiers |
| Instant node-level visibility | Netdata | Free tier, $4.50+/node |
| Log-first, ELK-native | OpenSearch Dashboards | Free (self-host) |
| Uptime + logs + status pages, cheap | Better Stack | Free tier, $25+/mo |
| CNCF-native Grafana successor | Perses | Free (open source) |
| Ops dashboard for your AI product | thefrontkit NeuralDesk | $131+ one-time |
What Grafana Actually Does Well
Grafana is the default for a reason: it visualizes anything. 150+ data sources, a panel ecosystem nothing rivals, and dashboards-as-code when you enforce it. The LGTM stack (Loki, Grafana, Tempo, Mimir) is a complete open-source observability platform, and Grafana Cloud's free tier is generous. For teams with platform engineering capacity, it remains the power pick.
The alternatives win on operational weight, on integration coherence, or on being the right tool when Grafana was the wrong abstraction.
When to Leave Grafana
Three signals:
- The stack owns an engineer. When maintaining Prometheus, Loki, and dashboard JSON is a standing line item, "free" stopped being free.
- Dashboards became write-only. Hundreds of panels nobody reads means the tool is a museum, not an instrument.
- You're dashboarding a product, not infrastructure. Business and AI-product metrics jammed into Grafana panels usually deserve a real application instead.
1. Datadog
The everything-managed incumbent.
Strengths:
- Metrics, logs, traces, RUM, security, and 800+ integrations in one coherent platform
- Zero infrastructure to run; onboarding measured in hours
- Correlation across signals that assembled stacks struggle to match
- Best-in-class alerting and incident workflows
Weaknesses:
- The bill. Usage-based pricing across a dozen SKUs surprises teams quarterly
- Per-host, per-GB, per-everything math punishes scale
- Vendor lock-in is real
Best for: Teams that want observability as a utility and will pay for it. Its market is mapped in our Datadog alternatives guide.
2. New Relic
The all-in-one with simpler pricing.
Strengths:
- One platform, one agent story, one bill: users plus data ingested
- Generous free tier (100GB/month) that small teams live in
- Full APM depth: traces, errors, profiling
- Less SKU sprawl than Datadog
Weaknesses:
- Per-user pricing gets expensive for wide teams
- UI density; the platform tries to do everything
- Query language (NRQL) is its own commitment
Best for: Teams that want Datadog's scope with more predictable billing.
3. SigNoz
The open-source alternative to both Grafana and Datadog at once.
Strengths:
- Metrics, traces, and logs in one open-source tool: no assembling Loki + Tempo + Prometheus
- OpenTelemetry-native from the ground up
- Self-hosted free, or cloud from reasonable tiers
- One UI, one query experience, coherent by design
Weaknesses:
- Younger than the Grafana ecosystem; fewer integrations and panels
- ClickHouse underneath is its own operational commitment self-hosted
- Community is growing but smaller
Best for: Teams that wanted the LGTM stack's capabilities without operating four systems.
4. Netdata
Instant, granular, zero-config node monitoring.
Strengths:
- Install one agent, get per-second metrics and auto-generated dashboards immediately
- Astonishing out-of-box coverage with no configuration
- Free tier covers small fleets; paid from $4.50/node
- Tiny resource footprint
Weaknesses:
- Node-centric: weak for application traces and business metrics
- Long-term retention and cross-fleet views need paid cloud
- Not a general dashboarding tool
Best for: Small teams that want infrastructure visibility today, not after a quarter of Prometheus setup.
5. OpenSearch Dashboards
The log-first option, ELK lineage.
Strengths:
- Free, open source, Apache-licensed fork of Kibana
- The strongest log exploration and search on this list
- Visualization plus alerting plus anomaly detection included
- AWS-managed option removes the ops burden
Weaknesses:
- Metrics and traces are secondary citizens
- The cluster is heavy to run yourself
- Dashboarding polish trails Grafana
Best for: Log-dominant workloads and teams already on the OpenSearch/Elasticsearch path.
6. Better Stack
The pragmatic pick for uptime, logs, and status pages.
Strengths:
- Uptime monitoring, incident management, log tail, and status pages in one clean product
- The best-designed UI in this roundup
- Free tier is real; paid from $25/month flat-ish
- Setup in an afternoon
Weaknesses:
- Not a full observability platform: no deep APM or traces
- Metrics dashboarding is basic
- Young compared to incumbents
Best for: Product teams that need "is it up, what broke, tell customers" more than they need histograms.
7. Perses
The CNCF-native dashboard successor.
Strengths:
- CNCF sandbox project designed as a lighter, spec-driven Grafana successor
- Dashboards-as-code first-class, GitOps-friendly
- Native Prometheus/Thanos focus without Grafana's sprawl
- Embeddable by design
Weaknesses:
- Early-stage: fewer panels, data sources, and users
- Metrics-centric; no logs or traces story
- Small community
Best for: Platform teams that love Prometheus, want dashboards-as-code, and would rather adopt a spec than a product.
8. Build the Ops Dashboard with NeuralDesk
The build path is for the case Grafana was never designed for: the operations dashboard of your product, especially AI products. Token spend per customer, model latency percentiles, prompt version performance, incident views your support team can read. Grafana panels over Postgres can fake it; your team deserves an application.
What this looks like:
- Your backend owns the metrics that matter (usage, cost, latency, quality evals)
- NeuralDesk provides the frontend: model management, prompt engineering views, token usage monitoring, latency dashboards, and incident screens
- Next.js + Tailwind + shadcn/ui, WCAG AA, token-driven theming
- One-time $99-$349
For why generic ops dashboards fail their audiences, see Why AI Ops Dashboards Don't Prevent Incidents.
Recommendation by Team Profile
| You | Pick |
|---|---|
| Want it all managed, budget exists | Datadog |
| Want scope with billing sanity | New Relic |
| Open source, one coherent tool | SigNoz |
| Need visibility today | Netdata |
| Logs are the workload | OpenSearch Dashboards |
| Uptime + status pages + logs, simply | Better Stack |
| Prometheus-native, dashboards-as-code | Perses |
| Dashboarding your AI product | Build with NeuralDesk |
Pricing at a Glance (Mid-Size Stack, Annual)
| Product | Typical setup | ~Annual cost |
|---|---|---|
| Grafana Cloud (Pro) | Usage-based | $1,000-6,000+ |
| Self-hosted LGTM stack | Free | Hosting + ~engineer-week/month |
| Datadog | Usage-based | $10,000-100,000+ |
| New Relic | 100GB free, then usage | $0-15,000+ |
| SigNoz (self-hosted) | Free | Hosting (~$600-1,800) |
| Netdata (20 nodes) | $4.50/node/mo | $1,080 |
| OpenSearch (self-managed) | Free | Cluster hosting (~$1,200+) |
| Better Stack (Team) | ~$100/mo | ~$1,200 |
| NeuralDesk (build path) | One-time $131-$349 | $131-$349 once, plus hosting |
Directional numbers; observability pricing is notoriously workload-dependent. The honest comparison is total cost including the engineer time self-hosted stacks consume.
Frequently Asked Questions
What is the best free alternative to Grafana?
SigNoz self-hosted, if you want metrics, traces, and logs in one tool instead of assembling the LGTM stack. Netdata, if infrastructure visibility with zero setup is the goal. Both are genuinely free at small scale, with hosting as the only cost.
What is the best open-source alternative to Grafana?
SigNoz for a full observability platform; Perses for a lighter, spec-driven dashboarding layer if you're staying Prometheus-native; OpenSearch Dashboards for log-first workloads. Each replaces a different part of what Grafana does.
Is Grafana still worth it in 2026?
For teams with platform engineering capacity, yes: nothing matches its data-source breadth and panel ecosystem. The question isn't Grafana's quality; it's whether you should be operating an observability stack at all. Teams under ~20 engineers usually shouldn't.
What should I use for business or AI-product metrics instead of Grafana?
Grafana can chart them, but business users won't live in it, and product metrics deserve product UI. For AI products specifically (token spend, model latency, prompt performance), NeuralDesk ships those screens as a real application you own; for general SaaS metrics, see our SaaS metrics dashboard roundup.
How hard is it to migrate off Grafana?
Dashboards are JSON, but they're Grafana-shaped JSON: nothing imports them cleanly. The realistic migration is re-instrumenting with OpenTelemetry (which SigNoz, Datadog, and New Relic all speak natively) and rebuilding only the dashboards people actually open. Audit view counts first; most teams discover 80% of panels have no audience.
The Honest Take
Grafana remains the power tool, and power tools have owners' manuals. Datadog and New Relic sell freedom from the manual at SaaS prices. SigNoz open-sources that coherence. Netdata and Better Stack solve the small team's actual problem (visibility, uptime, communication) without a platform project.
And when the dashboard you keep trying to build in Grafana is really your product's ops console, stop fighting the abstraction. That's an application, and applications are built, not configured.
Want it shipped without hiring a developer?
The build path above assumes you have engineers. If you don't, the team behind thefrontkit does done-for-you launches: we deploy the kit, apply your branding, and wire it to your stack. Fixed quotes, most builds ship in 2-4 weeks, from $1999.